Free Access
Fig. 2
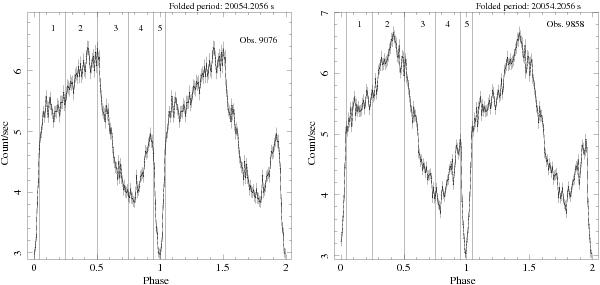
Folded light curves corresponding to Obs. ID. 9076 (left panel) and Obs. ID. 9858 (right panel). The data were folded adopting the X-ray ephemeris obtained by Iaria et al. (2011) and using 128 channels per period. The vertical lines indicate the phase intervals used for the phase-dependent spectral analysis (see Sect. 3.3).
This figure is made of several images, please see below:
Current usage metrics show cumulative count of Article Views (full-text article views including HTML views, PDF and ePub downloads, according to the available data) and Abstracts Views on Vision4Press platform.
Data correspond to usage on the plateform after 2015. The current usage metrics is available 48-96 hours after online publication and is updated daily on week days.
Initial download of the metrics may take a while.