| Issue |
A&A
Volume 548, December 2012
|
|
|---|---|---|
| Article Number | L7 | |
| Number of page(s) | 5 | |
| Section | Letters | |
| DOI | https://doi.org/10.1051/0004-6361/201220527 | |
| Published online | 27 November 2012 | |
Searching for Galactic sources in the Swift GRB catalog
Statistical analyses of the angular distributions of FREDs⋆
1 Instituto de Astrofísica de Andalucía (IAA-CSIC), Spain
e-mail: This email address is being protected from spambots. You need JavaScript enabled to view it.
2 Universidad de Jaén, Spain
3 Nikolaev National University, Ukraine
4 Eötvös University, Budapest, Hungary
5 Bolyai Military University, Budapest, Hungary
Received: 9 October 2012
Accepted: 5 November 2012
Abstract
Context. Since the early 1990s, gamma ray bursts (GRB) have been accepted to be of extra-Galactic origin because of the isotropic distribution observed by BATSE and the redshifts observed via absorption line spectroscopy. Nevertheless, upon closer examination at least one case turned out to be of Galactic origin. This particular event presented a fast rise and exponential decay (FRED) structure, which leads us to believe that other FRED sources might also be Galactic.
Aims. This study was set out to estimate the most probable degree of contamination by Galactic sources that certain samples of FREDs have.
Methods. To quantify the degree of anisotropy, the average dipolar and quadripolar moments of each sample of GRBs with respect to the Galactic plane were calculated. This was then compared to the probability distribution of simulated samples comprising a combination of isotropically generated sources and Galactic sources.
Results. We observe that the dipolar and quadripolar moments of the selected subsamples of FREDs are found more than two standard deviations outside those of random isotropically generated samples. The most probable degree of contamination by Galactic sources for the FRED GRBs of the Swift catalog detected until February 2011 that do not have a known redshift is about 21 out of 77 sources, which represents roughly 27%. Furthermore, we observe that by removing from this sample those bursts that have any type of indirect redshift indicator and multiple peaks, the most probable contamination increases to 34% (17 out of 49 sources).
Conclusions. It is probable that a high degree of contamination by Galactic sources occurs among the single-peak FREDs observed by Swift. Accordingly, we encourage additional studies on these types of events to determine the nature of what could be an exotic type of Galactic source.
Key words: gamma-ray burst: general / stars: magnetars / methods: statistical
Appendix A is available in electronic form at http://www.aanda.org
© ESO, 2012
1. Introduction
Gamma ray bursts (GRBs) are the most energetic explosions known in the Universe, second only to the Big Bang. Discovered in the 1960s, they were widely believed to originate in the Milky Way because of their relatively high flux of photons, which needs an unprecedented emission mechanism to account for this high energy output. It was not until 1997 when the first measurement of redshift was performed on a GRB afterglow that the cosmological nature of these objects was asserted without doubt (Metzger et al. 1997).
The GRB afterglows fade within a few hours, and as a consequence, the redshift of most GRBs are unknown. In the past several studies have been carried out to indirectly determine the Galactic or extra-Galactic nature of the bursts by analyzing their spatial distribution in the sky (Mazets et al. 1981; Meegan et al. 1992; Balazs et al. 1998), and historically it served as a strong argument against the Galactic origin of GRBs (Paciesas et al. 1999). This technique has also been used to suggest a more local nature of long-lag bursts by showing that they may be related to the super-Galactic structure (Norris 2002; Foley et al. 2008).
The observed light curve of each GRB varies from burst to burst, particularly during in the prompt phase when the gamma ray emission is emitted, where one or multiple peaks with a variety of shapes are observed. However, some of them present a fast rise and exponential decay (FRED hereafter) behavior. These have been correlated with other properties of the bursts (Bhat et al. 1994), suggesting that they may be of a different nature than other GRBs.
There has been at least one reported GRB that upon closer examination has resulted to be a phenomenon from within the Milky Way (Castro-Tirado et al. 2008; Stefanescu et al. 2008). This source displayed a FRED structure, which leads us to believe that there could be others like it.
We aim to estimate the most probable degree of contamination by Galactic sources that certain samples of FREDs have. We have organized the paper as follows: in Sect. 2 we establish the selection criteria of the studied samples. Sect. 3 describes the methodology used for quantifying the anisotropy and determining the probability of observing these values for both extra-Galactic and Galactic sources while taking into account the exposure of Swift. We discuss the results from our analysis in Sect. 4 and give our main conclusions in Sect. 5.
2. Sample selection
To achieve a homogeneous distribution, only Swift-detected GRBs were taken into account. From the catalog of 596 GRBs detected by Swift before March 2011, 111 GRBs were selected because they had a FRED structure reported in a GCN. Using the information available in peer-reviewed papers1 and other GCN circulars related to the 111 FRED GRBs, the following subsamples were selected2:
-
Sample 1: all 111 FREDs detected by Swift until February 2011.
-
Sample 2: 77 FREDs without any measured redshift.
-
Sample 3: 71 FREDs without stated high-redshift criteria.
-
Sample 4: 59 FREDs without any type of indirect redshift indication.
-
Sample 5: 49 FREDs without any redshift indications or multiple peaks.
It is important to note that only sample 5 included solely those bursts that consisted of one pure FRED peak.
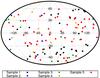 |
Fig. 1 Sources in each one of the samples. To avoid redundancy, only the sources not present in the subsequent samples were included. |
3. Anisotropy quantification
It has been proven (Hartmann & Epstein 1989) that the mean dipolar and quadripolar moments of the Galactic coordinates (cosb and sin2b, where b is the Galactic latitude) are good tools to quantify the isotropy with respect to the Galactic plane (Castro Tirado 1994). The degree of isotropy of each sample was calculated using the coordinates available from the gamma-ray burst coordinate network (GCN) circulars for each burst. The results are shown in Table 1.
Dipolar and quadripolar moments of the samples as a quantitative measurement of the degree of isotropy in the samples.
3.1. Exposure map
Owing to the nature of its instruments, orbit, and mission, Swift’s pointing toward the sky is not homogeneous. It is of particular relevance to note that there has been less integrated exposure time toward the Milky Way’s disk than toward the Galactic poles. This fact would represent a bias for the nature of the study carried out for this publication if left unaccounted, therefore we created a map by integrating the exposure mask function for the BAT instrument, multiplied by the exposure times of all observations carried out between April 16, 2005 and February 1, 2011, taking into account the pointing and rotation of the BAT instrument3.
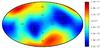 |
Fig. 2 Swift exposure map in Galactic coordinates derived for this study. Colors represent the exposure time (in seconds). |
3.2. Monte Carlo simulations
Monte Carlo simulations were carried out to determine the probability mass function (PMF) of the average dipolar and quadripolar moments of random GRB distributions. Therefore random coordinates were generated, taking care that they had a homogeneous distribution on an spherical surface.
These random points were then used to determine the PMF of the dipolar and quadripolar moments of random sources in the sky to determine by how much the observed samples’ values deviated from those of a completely isotropically generated sample. To do this we generated an equal number of random points to that of each sample, recording the value of the mean dipolar and quadripolar moment and iterating a statistically significant number of times 106−109 iterations. The histogram of the recorded values was then used to determine the values for standard deviations (σ,2σ,3σ).
3.3. Metropolis-Hastings algorithm
To account for the anisotropy of Swift’s exposure of the night sky, it was necessary to factor in the probability that a particular random source was detected by Swift. We used the Metropolis-Hastings algorithm for this, which can be summarized in three steps:
-
1.
Create a random source (set of coordinates).
-
2.
Create a random number with a range equal to the values of the map or mask.
-
3.
Compare the value of the map at those coordinates to the random number.
-
4.
If the value of the point on the map exceeds the random number, then the random source is included in the sample for further analysis. Otherwise a new random source is created and the process is repeated until the correct amount of sources is obtained.
This will effectively generate random sources that are more likely to appear where the exposure is higher. This method was tested by generating a statistically significant number of random sources and checking that the resulting image was one proportional to the weighting mask well within normal statistical fluctuations.
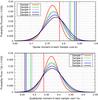 |
Fig. 3 Dipolar (top) and quadripolar (bottom) moment PMFs for samples of isotropically generated sources weighted by Swift’s exposure map for each sample size, and the observed values for each sample (vertical lines). |
3.4. Contamination by Galactic sources
Considering that i) the density of matter of the Milky Way is roughly correlated with the amount of interstellar dust, and by consequence so is the amount of stellar sources, and ii) the transparency of gamma-rays to interstellar dust, we used maps of dust IR emission (Schlegel et al. 1998) as a weighting mask for the Metropolis-Hastings algorithm to generate random Galactic sources.
The isotropically generated samples were contaminated by increasing the number of Galactically generated random sources (N) to observe how this affected the PMF of their dipolar and quadripolar moment. We considered all possible combinations for the number of GRBs in the different samples and took into account the Swift exposure map for each generated source.
4. Results
The Monte Carlo simulations of the isotropically generated random samples (weighted by the Swift exposure map) showed that the dipolar and quadripolar moments from the real samples consistently deviated from the average, as is shown in Fig. 3.
Table 2 lists the percentile of the population in which each sample is located. Considering that by definition, one standard deviation will be between the 15.87th and the 84.13th percentiles, two standard deviations between 2.28th and 97.72th and three deviations between 0.13th and 99.87th, we observe that with the exception of the first sample, all samples have dipolar and quadripolar moments located outside two standard deviations.
Percentile of the values observed for the dipolar and quadripolar moments of each sample.
The probability distribution of samples that contained both isotropically and Galactically generated sources allowed us to compare how the contamination by Galactic sources affected the likelihood of obtaining certain momentum values, for example see Fig. 4. This technique is similar to the one used in the past for studying the degree of contamination by Galactic repeater gamma-ray sources present in two GRB catalogs (Gorosabel et al. 1998).
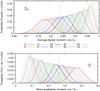 |
Fig. 4 Example of dipolar (top) and quadripolar (bottom) moment probability distributions for samples of 49 randomly generated sources with an increasing number (N) of those sources being of Galactic origin, and the observed value for sample #5 (dashed vertical line). Each line has a different amount of Galactic sources, starting with N = 0 (red), and only every fifth line was colored for easier reading. |
By observing the probability of the observed values in each one of the curves that resulted from the simulations, we determined the relative probability that each one of those combinations of isotropically and Galactically generated sources would yield the observed momentums. Figure 5 shows the probability as a function of the amount of Galactic sources introduced in each sample.
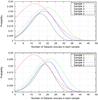 |
Fig. 5 Relative probability of obtaining the dipolar (top) and quadripolar (bottom) moments ± 0.002 measured for our samples. |
5. Conclusions
With the exception of the first sample, all observed samples show dipolar and quadripolar moments outside two standard deviations from the mean of an isotropically generated distribution. Although this result is not conclusive, there is a high probability that the samples are not of a purely extra-Galactic nature.
The probability of obtaining the dipolar and quadripolar moments that are measured in the samples is much higher when including a significant amount of Galactic sources than it is for only isotropically generated sources.
As shown in Table 3, if we consider the amount of contamination that yields the highest probability of obtaining the observed values, the amount of Galactic sources that are probably contaminating the Swift GRB catalog is between 16 and 22. This value represents approximately 3% of the catalog used for this study.
Sample 5 has been narrowed down so that it is likely that one out of every three is in fact a Galactic source, accordingly, it is of great interest to study these sources in more detail to determine if there are other indications that they are not GRBs.
The high Galactic extinction discourages optical ground-based spectroscopy of most low Galactic latitude GRBs. We showed that a large part of those abandoned follow-ups could reveal a missing population of Galactic events. We encourage ground observers to follow-up those events, since it might lead to the discovery of unknown high-energy phenomena in our Galaxy.
Amount of Galactic sources that yield a higher probability to obtain the observed dipolar and quadripolar moments and the percentage of the sample size they imply.
Online material
Appendix A
This appendix specifies which bursts are included in each one of the five samples used in this study. To facilitate its reading each column was named in reference to the discriminating parameter for each subsample. That is:
-
Sample 1: all 111 FREDs detected by Swift beforeMarch 2011.
-
Sample 2: 77 FREDs without any measured redshift different from zero
-
Sample 3: 71 FREDs without any claimed high redshift criteria
-
Sample 4: 59 FREDs without any type of indirect redshift indication
-
Sample 5: 49 FREDs without any redshift indications or multiple peaks
With the exception of the first column and where noted otherwise, each number refers to the GCN circular.
GRBs of the samples used for this study and the GCN used to discriminate each burst.
Only two peer-reviewed papers were relevant for the sample selection (Clemens et al. 2011; Perley et al. 2009).
For a list of specific selected bursts see Appendix A.
The method used to derive the exposure map is the same as the one detailed in Veres et al. (2010).
Acknowledgments
We have made use of J. Greiner’s GRB Table (http://www.mpe.mpg.de/~jcg/grbgen.html). This research has been partially supported by the Spanish Ministry of Economy and Competitivity under the programmes AYA2011-24780/ESP, AYA2009-14000-C03-01/ESP, and AYA2012-39362-C02-02 and OTKA grant K077795.
References
- Balazs, L. G., Meszaros, A., & Horvath, I. 1998, A&A, 339, 1 [NASA ADS] [Google Scholar]
- Bhat, P. N., Fishman, G. J., Meegan, C. A., et al. 1994, ApJ, 426, 604 [NASA ADS] [CrossRef] [Google Scholar]
- Castro Tirado, A. J. 1994, The WATCH experiment: 1000 days observing the X-ray universe [Google Scholar]
- Castro-Tirado, A. J., de Ugarte Postigo, A., Gorosabel, J., et al. 2008, Nature, 455, 506 [NASA ADS] [CrossRef] [PubMed] [Google Scholar]
- Clemens, C., Greiner, J., Krühler, T., et al. 2011, A&A, 529, A110 [NASA ADS] [CrossRef] [EDP Sciences] [Google Scholar]
- Foley, S., McGlynn, S., Hanlon, L., McBreen, S., & McBreen, B. 2008, A&A, 484, 143 [NASA ADS] [CrossRef] [EDP Sciences] [Google Scholar]
- Gorosabel, J., Castro-Tirado, A. J., Brandt, S., & Lund, N. 1998, A&A, 336, 57 [NASA ADS] [Google Scholar]
- Hartmann, D., & Epstein, R. I. 1989, ApJ, 346, 960 [NASA ADS] [CrossRef] [Google Scholar]
- Mazets, E. P., Golenetskii, S. V., Ilinskii, V. N., et al. 1981, Ap&SS, 80, 3 [Google Scholar]
- Meegan, C. A., Fishman, G. J., Wilson, R. B., et al. 1992, Nature, 355, 143 [NASA ADS] [CrossRef] [Google Scholar]
- Metzger, M. R., Djorgovski, S. G., Kulkarni, S. R., et al. 1997, Nature, 387, 878 [NASA ADS] [CrossRef] [Google Scholar]
- Norris, J. P. 2002, ApJ, 579, 386 [NASA ADS] [CrossRef] [Google Scholar]
- Paciesas, W. S., Meegan, C. A., Pendleton, G. N., et al. 1999, ApJS, 122, 465 [NASA ADS] [CrossRef] [Google Scholar]
- Perley, D. A., Cenko, S. B., Bloom, J. S., et al. 2009, AJ, 138, 1690 [NASA ADS] [CrossRef] [Google Scholar]
- Schlegel, D. J., Finkbeiner, D. P., & Davis, M. 1998, ApJ, 500, 525 [NASA ADS] [CrossRef] [Google Scholar]
- Stefanescu, A., Kanbach, G., Słowikowska, A., et al. 2008, Nature, 455, 503 [NASA ADS] [CrossRef] [Google Scholar]
- Veres, P., Bagoly, Z., Horváth, I., et al. 2010, in AIP Conf. Ser. 1279, eds. N. Kawai, & S. Nagataki, 457 [Google Scholar]
All Tables
Dipolar and quadripolar moments of the samples as a quantitative measurement of the degree of isotropy in the samples.
Percentile of the values observed for the dipolar and quadripolar moments of each sample.
Amount of Galactic sources that yield a higher probability to obtain the observed dipolar and quadripolar moments and the percentage of the sample size they imply.
GRBs of the samples used for this study and the GCN used to discriminate each burst.
All Figures
|
Fig. 1 Sources in each one of the samples. To avoid redundancy, only the sources not present in the subsequent samples were included. |
| In the text | |
|
Fig. 2 Swift exposure map in Galactic coordinates derived for this study. Colors represent the exposure time (in seconds). |
| In the text | |
|
Fig. 3 Dipolar (top) and quadripolar (bottom) moment PMFs for samples of isotropically generated sources weighted by Swift’s exposure map for each sample size, and the observed values for each sample (vertical lines). |
| In the text | |
|
Fig. 4 Example of dipolar (top) and quadripolar (bottom) moment probability distributions for samples of 49 randomly generated sources with an increasing number (N) of those sources being of Galactic origin, and the observed value for sample #5 (dashed vertical line). Each line has a different amount of Galactic sources, starting with N = 0 (red), and only every fifth line was colored for easier reading. |
| In the text | |
|
Fig. 5 Relative probability of obtaining the dipolar (top) and quadripolar (bottom) moments ± 0.002 measured for our samples. |
| In the text | |
Current usage metrics show cumulative count of Article Views (full-text article views including HTML views, PDF and ePub downloads, according to the available data) and Abstracts Views on Vision4Press platform.
Data correspond to usage on the plateform after 2015. The current usage metrics is available 48-96 hours after online publication and is updated daily on week days.
Initial download of the metrics may take a while.