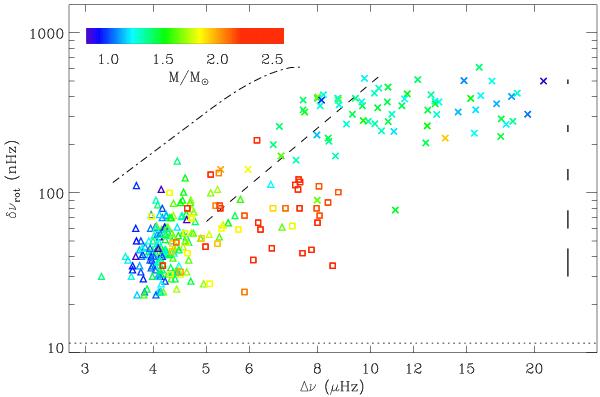
Fig. 6

Rotational splitting δνrot as a function of the large separation Δν, in log-log scale. The dotted line indicates the frequency resolution. The dashed and dot-dashed lines represent the confusion limit with mixed modes in RGB and clump stars, respectively, derived from Mosser et al. (2012c). Crosses correspond to RGB stars, triangles to clump stars, and squares to secondary clump stars. The color code gives the mass estimated from the asteroseismic global parameters. The vertical bars indicate the mean error bars, as a function of the rotational splitting.
Current usage metrics show cumulative count of Article Views (full-text article views including HTML views, PDF and ePub downloads, according to the available data) and Abstracts Views on Vision4Press platform.
Data correspond to usage on the plateform after 2015. The current usage metrics is available 48-96 hours after online publication and is updated daily on week days.
Initial download of the metrics may take a while.


