| Issue |
A&A
Volume 548, December 2012
|
|
|---|---|---|
| Article Number | A38 | |
| Number of page(s) | 11 | |
| Section | Interstellar and circumstellar matter | |
| DOI | https://doi.org/10.1051/0004-6361/201219919 | |
| Published online | 16 November 2012 | |
Probing the extent of the non-thermal emission from the Vela X region at TeV energies with H.E.S.S.
1
Universität Hamburg, Institut für Experimentalphysik,
Luruper Chaussee 149,
22761
Hamburg, Germany
2
Laboratoire Univers et Particules de Montpellier, Université
Montpellier 2, CNRS/IN2P3, CC 72,
Place Eugène Bataillon, 34095
Montpellier Cedex 5,
France
3
Max-Planck-Institut für Kernphysik, PO Box 103980, 69029
Heidelberg,
Germany
4
Dublin Institute for Advanced Studies,
31 Fitzwilliam Place,
Dublin 2,
Ireland
5
National Academy of Sciences of the Republic of
Armenia, Yerevan,
Armenia
6
Yerevan Physics Institute, 2 Alikhanian Brothers St., 375036
Yerevan,
Armenia
7
Universität Erlangen-Nürnberg, Physikalisches
Institut, Erwin-Rommel-Str.
1, 91058
Erlangen,
Germany
e-mail: This email address is being protected from spambots. You need JavaScript enabled to view it.
8
University of Durham, Department of Physics,
South Road, Durham
DH1 3LE,
UK
9
Nicolaus Copernicus Astronomical Center, ul. Bartycka
18, 00-716
Warsaw,
Poland
10
CEA Saclay, DSM/Irfu, 91191
Gif-Sur-Yvette Cedex,
France
11
APC, AstroParticule et Cosmologie, Université Paris Diderot,
CNRS/IN2P3, CEA/Irfu, Observatoire de Paris, Sorbonne Paris Cité, 10, rue Alice Domon et Léonie
Duquet, 75205
Paris Cedex 13,
France
12
Laboratoire Leprince-Ringuet, École Polytechnique,
CNRS/IN2P3, 91128
Palaiseau,
France
13
Institut für Theoretische Physik, Lehrstuhl IV: Weltraum und
Astrophysik, Ruhr-Universität Bochum, 44780
Bochum,
Germany
14
Institut für Physik, Humboldt-Universität zu Berlin,
Newtonstr. 15, 12489
Berlin,
Germany
15
LUTH, Observatoire de Paris, CNRS, Université Paris
Diderot, 5 place Jules
Janssen, 92190
Meudon,
France
16
LPNHE, Université Pierre et Marie Curie Paris 6, Université Denis
Diderot Paris 7, CNRS/IN2P3, 4 place Jussieu, 75252, Paris Cedex
5, France
17
Institut für Astronomie und Astrophysik, Universität
Tübingen, Sand 1,
72076
Tübingen,
Germany
18
Astronomical Observatory, The University of Warsaw,
Al. Ujazdowskie 4, 00-478
Warsaw,
Poland
19
Unit for Space Physics, North-West University,
Potchefstroom
2520, South
Africa
20
Landessternwarte, Universität Heidelberg,
Königstuhl, 69117
Heidelberg,
Germany
21
Oskar Klein Centre, Department of Physics, Stockholm University,
Albanova University Center, 10691
Stockholm,
Sweden
22
Université Bordeaux 1, CNRS/IN2P3, Centre d’Études Nucléaires de
Bordeaux Gradignan, 33175
Gradignan,
France
23
Funded by contract ERC-StG-259391 from the European Community
24
University of Namibia, Department of Physics,
Private Bag
13301, Windhoek, Namibia
25
School of Chemistry & Physics, University of
Adelaide, Adelaide
5005,
Australia
26
UJF-Grenoble 1/CNRS-INSU, Institut de Planétologie et
d’Astrophysique de Grenoble (IPAG) UMR 5274, 38041
Grenoble,
France
27
Department of Physics and Astronomy, The University of Leicester,
University Road, Leicester, LE1
7RH, UK
28
Instytut Fizyki Ja¸drowej PAN, ul. Radzikowskiego 152, 31-342
Kraków,
Poland
29
Institut für Astro- und Teilchenphysik,
Leopold-Franzens-Universität Innsbruck, 6020
Innsbruck,
Austria
30
Laboratoire d’Annecy-le-Vieux de Physique des Particules,
Université de Savoie, CNRS/IN2P3, 74941
Annecy-le-Vieux,
France
e-mail: This email address is being protected from spambots. You need JavaScript enabled to view it.
31
Obserwatorium Astronomiczne, Uniwersytet
Jagielloński, ul. Orla
171, 30-244
Kraków,
Poland
32
Toruń Centre for Astronomy, Nicolaus Copernicus
University, ul. Gagarina
11, 87-100
Toruń,
Poland
33
Charles University, Faculty of Mathematics and Physics, Institute
of Particle and Nuclear Physics, V
Holešovičkách 2, 180
00
Prague 8, Czech
Republic
34
School of Physics & Astronomy, University of
Leeds, Leeds
LS2 9JT,
UK
Received:
29
June
2012
Accepted:
28
September
2012
Abstract
Context. Vela X is a region of extended radio emission in the western part of the Vela constellation: one of the nearest pulsar wind nebulae, and associated with the energetic Vela pulsar (PSR B0833-45). Extended very-high-energy (VHE) γ-ray emission (HESS J0835−455) was discovered using the H.E.S.S. experiment in 2004. The VHE γ-ray emission was found to be coincident with a region of X-ray emission discovered with ROSAT above 1.5 keV (the so-called Vela X cocoon): a filamentary structure extending southwest from the pulsar to the centre of Vela X.
Aims. A deeper observation of the entire Vela X nebula region, also including larger offsets from the cocoon, has been performed with H.E.S.S. This re-observation was carried out in order to probe the extent of the non-thermal emission from the Vela X region at TeV energies and to investigate its spectral properties.
Methods. To increase the sensitivity to the faint γ-ray emission from the very extended Vela X region, a multivariate analysis method combining three complementary reconstruction techniques of Cherenkov-shower images is applied for the selection of γ-ray events. The analysis is performed with the On/Off background method, which estimates the background from separate observations pointing away from Vela X; towards regions free of γ-ray sources but with comparable observation conditions.
Results. The γ-ray surface brightness over the large Vela X region reveals that the detection of non-thermal VHE γ-ray emission from the PWN HESS J0835−455 is statistically significant over a region of radius 1.2° around the position α = 08h35m00s, δ = −45°36′00′′ (J2000). The Vela X region exhibits almost uniform γ-ray spectra over its full extent: the differential energy spectrum can be described by a power-law function with a hard spectral index Γ = 1.32 ± 0.06stat ± 0.12sys and an exponential cutoff at an energy of (14.0 ± 1.6stat ± 2.6sys) TeV. Compared to the previous H.E.S.S. observations of Vela X the new analysis confirms the general spatial overlap of the bulk of the VHE γ-ray emission with the X-ray cocoon, while its extent and morphology appear more consistent with the (more extended) radio emission, contradicting the simple correspondence between VHE γ-ray and X-ray emissions. Morphological and spectral results challenge the interpretation of the origin of γ-ray emission in the GeV and TeV ranges in the framework of current models.
Key words: radiation mechanisms: non-thermal / ISM: individual objects: Vela X / ISM: individual objects: HESS J0835 / 455 / gamma rays: general
© ESO, 2012
1. Introduction
Very-High-Energy (E ≥ 100 GeV) photon emission originating from about one hundred astrophysical sources populating the Galactic Plane has been detected in recent years. A significant fraction of Galactic VHE γ-ray sources are pulsar wind nebulae (PWNe), which are interpreted as bubbles filled with a plasma of highly energetic particles. PWNe are associated with pulsars, whose rotational energy is converted into the kinetic energy of a plasma of charged particles (see Gaensler & Slane 2006, and references therein for a recent review).
Vela X was originally discovered by Rishbeth (1958) as one of three radio sources in the western part of the Vela constellation. Rishbeth (1958) already presumed that Vela X stands out in comparison to the other two objects (Vela Y, Vela Z), as its radio spectrum tends to be flatter. A review of radio observations of the region was given by Alvarez et al. (2001). The size of the Vela X radio emission is coarsely given as 3° in the east-west direction and 2° in the north-south direction. Vela X was interpreted as a PWN associated with the pulsar PSR B0833-45 (Weiler & Panagia 1980). A pulsar distance of about 290 pc is derived from radio and optical parallax measurements (Caraveo et al. 2001; Dodson et al. 2003). As a side-product of the parallax measurement, a proper motion velocity of 65 km s-1 was found, which represents a comparatively slow motion with respect to typical pulsar velocities, that has prevented the pulsar from escaping from the nebula bubble. The Vela pulsar exhibits a rotational period of 89.3 ms (Large et al. 1968) and a period derivative of 1.25 × 10⁻¹³ s s-1 (Lyne et al. 1996), corresponding to a spin-down luminosity of 6.9 × 1036 erg s-1. PSR B0833-45 is the only middle-aged pulsar with a PWN for which a braking index has been measured (n = 1.4, Lyne et al. 1996). The commonly quoted characteristic age of the pulsar is 11 kyr (assuming n = 3, that is, magnetic dipole radiation to be responsible for the spin-down of the pulsar). A large step forward in the understanding of Vela X came with the X-ray mission ROSAT in the mid 1990s. According to the ROSAT data, the shell of the Vela supernova remnant (SNR) is extended over a large region of diameter ≈8°. Beyond the shell several fragments have been found with trajectories pointing back towards the pulsar, so that shell and pulsar are associated as remnants of the same SN explosion (Aschenbach et al. 1995). An elongated X-ray filament was observed at the centre of Vela X using ROSAT (Markwardt & Ögelman 1995). The filament, primarily seen at energies between 1.3 keV and 2.4 keV, is oriented along the north-south direction. These measurements were confirmed by observations performed using ASCA (Markwardt & Ögelman 1997), which yielded an estimated length for this filament of about 45′ (from the pulsar to the centre of Vela X). The term cocoon stems from the original and nowadays obsolete interpretation of the X-ray filament as a jet outgoing from the pulsar and filling a cocoon about its head. More detailed X-ray observations took place recently, covering a larger region including to the north of the cocoon: a hard X-ray emission has been detected just outside Vela X in the energy range 2–10 keV using Suzaku/XIS (Katsuda et al. 2011). Observations performed with the Chandra satellite have resolved a structured PWN within ≃1′ of the pulsar, showing jet-like emission aligned with the direction of the pulsar’s proper motion. These data have provided the prime evidence for the pulsar wind (Helfand et al. 2001; Pavlov et al. 2001, 2003). The X-ray flux in the 3–10 keV energy range measured with XMM-Newton/MOS and BeppoSAX/MECS shows a spectral index gradually softening from an index of 1.60 to 1.90 in annular integration regions within 15′ from the pulsar position (Mangano et al. 2005).
Furthermore, extended emission above 18 keV from the Vela nebula on the northern side of the cocoon was observed with the INTEGRAL satellite (Mattana et al. 2011). This new diffuse component has no known counterparts and appears larger and more significant than the southern part, which is partially coincident with the soft X-ray cocoon. The origin of the northern hard X-ray emission might be due to the injection of relatively fresh particles into the nebula. The modelling of the spectrum within 6′ from the pulsar and in the energy range from 18 to 400 keV implies a magnetic field higher than 10 μG.
The Vela X cocoon was observed with the VLA, revealing a bright radio filament coincident with the eastern edge of the X-ray filament (Frail et al. 1997). Moreover, a network of similar radio filaments was discovered across the whole radio PWN with extended observations by the Molonglo Observatory Synthesis Telescope (MOST, Bock et al. 1998), whereas only the central one is visible in X-rays. A suggested explanation for these filaments is that they arise from Rayleigh-Taylor (RT) instabilities, due to the accelerated expansion of the nebula into the surrounding medium. Such acceleration is expected to occur in the free expansion phase (for PWNe with an age of about 1 kyr), or in the reverberation phase, when the nebula is first adiabatically compressed by the reverse shock of the SNR and then re-expands due to the rising pressure inside the PWN. Gelfand et al. (2009) presented the simulated evolution of a PWN inside a SNR over 100 kyr. Following their model, PWNe with ages of about 20 kyr are characterised by a large magnetisation parameter (i.e. the ratio of magnetic field to particle energy), and will show RT-filament growth. The RT instabilities will allow the magnetic field lines to rearrange themselves parallel to the filaments, so that the plasma particles are bound within this region. The concept of an aligned magnetic field is supported by the measurement of the orientation of the magnetic field by Milne (1995).
The Vela pulsar is located at the northern edge of the radio nebula. The offset between the pulsar and the centre of the PWN can be explained by the interaction of the PWN with the SNR shell. While the forward shock (FS) of the SNR expands into the ISM, the reverse shock (RS), after moving outwards behind the FS for the first several hundred years after the supernova explosion, reverts its direction and moves inwards towards the centre of the SNR. It eventually collides with the PWN developing inside the SNR, causing a compression and potentially a displacement of the nebula. A non-uniform density of the interstellar medium may affect the uniformity of the expansion velocity of the FS, and hence the reversal of the RS, in the sense that the RS will return earlier from a direction where the shock encounters a denser medium. The cocoon is ascribed to an asymmetric reverse shock, which stripped the bulk of the particles from around the pulsar, thus leaving behind a relic PWN developed along the main X-ray axis, which is perpendicular to the direction of the Vela pulsar proper motion (Blondin et al. 2001). In the case of the Vela SNR, evidence for a non-uniform ISM density was indeed found: an atomic hydrogen density of 1–2 particles per cm3 for the northern parts of the SNR (Dubner et al. 1998), compared with a density of 0.1 particles per cm3 for the southern ISM (Ferreira & de Jager 2008). Thus, the RS is assumed to have returned first from the northern part of the SNR and to have pushed the PWN about 1° to the south, where the position of the nebula was eventually confined by the southern part of the RS.
The H.E.S.S. collaboration reported VHE γ-ray emission from Vela X (Aharonian et al. 2006a) and found its morphological extent to be coincident with the X-ray cocoon detected with ROSAT to the south of the pulsar position. A differential energy spectrum was extracted with an integration radius of 0.8° around the formal centre at RA = 08h35m00s, Dec = −45°36′00′′ (J2000), within the energy range 0.55−65 TeV. A fit of a power law yielded a spectral index Γ = 1.45 ± 0.09stat ± 0.2sys and an exponential cutoff at an energy of (13.8 ± 2.3stat ± 4.1sys) TeV. The total γ-ray flux, integrated in energy above 1 TeV, is (12.8 ± 1.7stat ± 3.8sys) × 10-12 cm-2 s-1. The integration region will be referred to in the following as the inner test region. The formal centre will hereafter be called the central position.
Following the H.E.S.S. observations, de Jager et al. (2008a) presented a two-zone leptonic model for Vela X which assumes constant magnetic field and plasma density throughout the Vela X region. In the model the Vela X PWN consists of two emission regions; while the X-ray cocoon and the VHE γ-ray observations appear to define a central region, radio observations reveal a more extended area 2° × 3° in size. The model proposes two distinct electron spectra, responsible for the radio and X-ray/VHE γ-ray emission, respectively. For a magnetic field strength of 5 μG this model reproduces an Inverse Compton (IC) energy maximum in the multi-TeV domain as observed with H.E.S.S., while predicting the total hard X-ray cocoon emission above 20 keV measured using instruments onboard the INTEGRAL satellite within a factor of two. De Jager et al. (2008a) also propose that a higher field strength in the radio filaments would imply fewer leptons in Vela X and hence a fainter signal in the GeV energy domain.
The measurements of the spectral energy distribution (SED) were recently supplemented in the high-energy domain, from 100 MeV to 20 GeV, by observations made using the space-borne missions AGILE (Pellizzoni et al. 2010) and Fermi (Abdo et al. 2010). The spectral results of these measurements agree with the expectations of the scenario of de Jager et al. (2008a) in which two particle populations are invoked to explain the high energy emissions in the GeV and TeV domains respectively. A recent attempt to unify these two populations and explain the steep spectral index measured with the Fermi-LAT (2.41 ± 0.09stat ± 0.15sys between 200 MeV and 20 GeV) as a consequence of particle escape has been proposed by Hinton et al. (2011).
Alternative scenarios to interpret the Vela X SED are also proposed (Bednarek & Bartosik 2003; Horns et al. 2006), where both leptons and hadrons contribute to the non-thermal emission, and in particular the VHE emission would result mainly from the hadronic contribution.
This work reports on re-observations of VHE γ-ray emission from the Vela X PWN with the H.E.S.S. telescope array. After a summary of the follow-up observations lately made with H.E.S.S., and a description of the data analysis applied to the investigation of Vela X (Sect. 2), the results regarding the spectrum (Sect. 3.1), the surface brightness (Sect. 3.2) and the morphology (Sect. 3.3) of the VHE γ-ray emission are detailed. A discussion (Sect. 4) on the results and possible multi-wavelength interpretation concludes this work.
2. H.E.S.S. observations and data analysis
The H.E.S.S. instrument consists of four 13 m diameter Imaging Air Cherenkov Telescopes (IACTs) located in the Khomas Highland in Namibia, 1800 m above sea level, and began operation in 2003 (Bernlöhr et al. 2003; Funk et al. 2004). The H.E.S.S. working principle is based on the detection of faint Cherenkov light from the γ-ray-induced air showers in the atmosphere, above an energy threshold of about 100 GeV up to several tens of TeV. The four telescopes are operated in a coincidence mode, in which at least two of them must have been triggered for each event within a coincidence window of 60 ns. Each telescope has a mirror area of 107 m2 and is equipped with a camera containing 960 photomultipliers. H.E.S.S. is ideally suited for the morphological study of extended VHE γ-ray sources due to its high sensitivity, angular resolution of a few arc minutes and large (5°) field of view. This said, the Vela X region is experimentally challenging: it is the most extended VHE γ-ray source detected so far and has a relatively low surface brightness.
2.1. Observations and data selection
A background for the measurement of VHE γ-rays arises from charged cosmic-ray particles, which also generate air showers. Typical methods to estimate the background make use of regions free of γ-ray sources in the same field of view. These off-target regions of typically circular or annular shape cover the same area as the on-target region and are placed such that on- and off-target regions represent reflections with respect to the pointing position (see Berge et al. 2007; Aharonian et al. 2006b, for more details). However, these (standard) methods are not ideally suited to observations of very extended sources such as Vela X. Therefore, the analysis is performed with the so-called On/Off background method (Weekes et al. 1989) which estimates the background from separate observations pointing away from Vela X, and towards γ-ray source-free regions with comparable observation conditions (Abramowski et al. 2012). The Vela X region was observed during several observation campaigns between 2004 and 2009. In 2004 data were taken using a method in which the source was offset by a small angular distance from the centre of the field of view (wobble mode). These observations were made at an offset of 0.5° in declination from the position of the Vela pulsar. Further observations from 2005 to 2007 were made surrounding the position measured as the centre of gravity of the VHE γ-ray excess. These were also taken in wobble mode, with a mean offset of 0.5°. Data taken during the 2008 and 2009 observation campaigns enlarged the data set by 30%. For the latter observations three more distant pointing positions offset by 1.3° from the central position were used, in order to study emission at a distance of up to 1.2° using the reflected annular background regions in the same field of view. The annular background method estimates the cosmic-ray background contribution at each trial position on the sky, by integrating events in an annulus centred on that position, excluding potential source regions. These pointing positions are given as black dots in the overview image (Fig. 1), where the associated reflected off-source ring regions are also illustrated. In total 126 runs (each of 28 min observing time) were obtained after standard data quality selection (Aharonian et al. 2006b) and by requiring that all four telescopes were operative (to guarantee the best possible angular resolution). These runs correspond to a total observation time of 53.1 h (12 h of which are part of the total observation time analysed in the past and published in 2006), of which 14.8 h were taken at a distance of 1.3° from the central position.
The On/Off background subtraction method requires particular care in the choice of the Off runs, which are taken from the general set of H.E.S.S. observations. Only those runs that can be considered free of VHE γ-ray sources are taken as Off runs. Each of the 126 On runs is paired with an Off run taken under matching observation conditions. After applying the aforementioned quality cuts to a list of potential Off runs, the selection is achieved by pairing On and Off runs such that the difference in the values of three relevant quantities is minimised. In order of their impact on the background rate, these quantities are: 1) the zenith angle of the observation: Vela X was observed at different altitudes in the sky (zenith angles ranging from 20° to 45°), which correspond to different energy thresholds; 2) the muon detection efficiency, which is used (Bolz 2004) to take the changing optical efficiency of the telescopes into account: mainly due to the ageing of the mirrors, the muon detection efficiency decreased by more than 20% over the course of the Vela X observation campaigns (2003–2009); 3) the trigger rate: this is affected by variable atmospheric conditions, in particular clouds and aerosol formations.
Residual differences between on-target and background runs are a potential source of systematic uncertainties. Therefore, in order to assess these systematics, parts of the observations were performed pointing 1.3° off the central position (as mentioned above) to provide data suitable for analysis with the in-field background method.
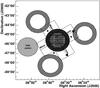 |
Fig. 1 Schematic overview of the region around Vela X. The star marks the position of the Vela pulsar PSR B0833-45. The light-grey area indicates the region 0.8° around the centre of the VHE γ-ray emission. The surrounding cross-hatched ring has an outer radius of 1.2°. The black dots mark the pointing positions that allow background estimation in reflected mode and which were chosen for the spectral analysis of the Vela X outer region (the cross-hatched ring). The line-filled rings are the associated reflected off-source regions. The two boxes are used to extract flux profiles (which are shown in Fig. 6), where the arrows indicate the direction of the slices (as explained in Sect. 3.3). The position of the nearby SNR Vela Junior (Aharonian et al. 2007) is also shown. |
2.2. Reconstruction and data analysis
We employed the Xeff analysis (Dubois 2009) for the selection of γ-ray events and for the suppression of cosmic-ray background events. Xeff denotes a multivariate analysis method developed to improve signal-to-background discrimination, which is important in searches for weak signals and morphological studies of extended sources (Dubois et al. 2009). The Xeff method improves the separation of γ and cosmic-ray events compared to the standard H.E.S.S. analysis (Aharonian et al. 2006b), by exploiting the complementary discriminating variables of three reconstruction methods1 in use in the H.E.S.S. analysis. The resulting unique discriminating variable Xeff acts as an event-by-event γ-misidentification probability estimator. The definition of the Xeff probability function follows the relation: 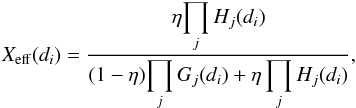 (1)where di are the discriminating variables of three reconstruction methods; Gj(di) and Hj(di) are the one-dimensional probability density functions (p.d.f.s) for events identified as γ-ray-like (G) and hadron-like (H) (the product of individual p.d.f.s replaces the global multi-dimensional ones since the variables di are highly uncorrelated); η is the misidentified fraction of the gamma class of events (i.e. the relative background fraction). The final γ-ray event selection was achieved with the set of cuts adapted to the detection of faint sources (η = 0.5, Xeff,cut = 0.3) and a cut in the reconstructed image charge requiring more than 80 photo-electrons. With this approach the background rejection is improved over the full energy range of H.E.S.S. allowing for an increased quality factor (defined as the ratio of γ-ray detection efficiency to the square root of residual cosmic-ray-proton efficiency) ranging from a factor of 1.6 (at 0.3 TeV) to 2.8 (at E > 10 TeV) with respect to the standard Hillas reconstruction method. Similarly, the shower direction and energy of γ-ray events are reconstructed by means of an estimator composed of the directions and energies reconstructed from the three methods previously referred to (Lyons et al. 1988; Dubois et al. 2009). A weighting factor taking into account the covariance matrices between estimates and minimising the corresponding variance is applied to the individual reconstruction variables (zi), to provide the best unbiased estimate of the observable ẑ. This procedure improves both the energy resolution (≃ 10% at E = 1 TeV and ≃ 15–20% for E > 10 TeV) and the angular resolution, resulting in a point spread function (PSF; 68% containment radius) between 0.05° and 0.07°.
For cross-check purposes the data analysis was also conducted, within the same analysis software, by applying each of the three above mentioned reconstruction methods individually. Furthermore, an independent standard Hillas analysis (i.e. using an independent data calibration, instrument response functions and analysis software) was performed (Glück 2011). In this independent analysis the event reconstruction is based on the scaled widths method using standard cuts as documented in Aharonian et al. (2006b) and Aharonian et al. (2006c). All analyses yielded compatible flux measurements within a 10% systematic error and a variation in spectral index of about 4%.
All analyses used in this work use separate observation runs for the background rejection to the signal collection (On/Off observation method). This could imply a residual systematic shift in the estimated background rate due to the differences in the observation conditions between the On and Off fields. These potential systematic shifts are considered by an acceptance correction factor applied to the absolute normalisation α, which is defined as the ratio between the live-times of the On and Off data.
Several tests were carried out to validate the systematic uncertainties and to verify the stability of the spectral results. For the subsets of data (for which it was possible) the background rates resulting from the application of the On/Off method and the reflected background regions method were compared. An approximate 8% uncertainty on the flux normalisation and a corresponding systematic uncertainty of 0.08 on the spectral index were estimated. These values were confirmed by applying the On/Off analysis to other γ-ray sources as well as to dark-field data sets (i.e. sky test regions without any detected VHE source). Performing the On/Off analysis independently on three distinct and statistically equivalent sub-sets of data enabled us to quantify 10% and 0.05 sytematic errors on the flux and the spectral index, respectively. Results obtained for all of the analysis chains with different sets of selection-cuts (namely hard, standard and loose cuts as explained in Aharonian et al. 2006b, 2006c) lead to an 8% error on the flux and to a systematic uncertainty of 0.06 on the spectral index, while these errors are 10% and 0.05, respectively, when the results of the two independent analysis chains are compared.
A summary of various estimated contributions to the systematic errors on the results of the spectral analysis is given in Table 1.
Various estimated contributions to the systematic error of the obtained flux and spectral index for this specific analysis.
3. Results
The analysis yields an excess of 4010 γ-ray events in the Vela X region, within a radial distance of 1.2° around the central position α = 08h35m00s, δ = −45°36′00′′ (J2000) and applying the minimum threshold of 0.75 TeV on the event reconstructed energy. The nominal energy threshold for observations with the H.E.S.S. experiment under ideal conditions and for a source observed at about 20° zenith angle is ~0.2 TeV. This threshold deteriorated to ~0.4 TeV due to the degrading optical efficiency of the mirrors associated with ageing. As mentioned, Vela X was observed at different altitudes in the sky with effective energy thresholds ranging from 0.4 TeV to more than 0.7 TeV. An energy cut Eth = 0.75 TeV was chosen to provide a homogeneous event sample with respect to the different threshold energies. The γ-ray excess has a significance of 27.9σ, while the signal-to-background ratio is 0.6. In the ring between the radii 0.8° and 1.2° around the central position a pre-trials significance of 7.5σ is measured. When the reflected background model is applied to the dedicated data sub-set (sample of observations performed with 1.3° off-pointing) a significance of 5.3σ is found. The difference in the significances for the two methods of background subtraction reflects the differences in observation times between On/Off data and data analysed with the reflected background method. Table 2 shows the summary of the event statistics.
Number Non of events in the test regions, the α factors, the number Nb of background events (corresponding to Noff × α), the resulting significance σ and the number of excess events Nγ for the On/Off background model.
3.1. Spectral analysis
The spectral analysis of the VHE γ-ray emission was conducted for the γ-like events reconstructed with energies higher than Eth = 0.75 TeV. All differential energy spectra of the VHE γ-ray emission have been obtained using a forward-folding method (Piron et al. 2001) based on the measured energy-dependent on-source and off-source distributions.
Best fit results of the differential energy spectra extracted for the inner and the external ring test regions as well as integrating over the total Vela X extension.
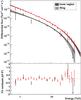 |
Fig. 2 Differential γ-ray spectrum of Vela X in the TeV energy range. Filled red circles: inner integration region <0.8°; open black circles: ring extension (between 0.8° and 1.2°). Both spectra are fitted with a power law with exponential cutoff. The shaded bands correspond to the statistical uncertainty of the fit. |
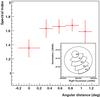 |
Fig. 3 Spectral indices as a function of radial distance to the pulsar position along the major axis of Vela X. The insert shows a graphic of the five sectors on the sky-map (with radial distances of 0° (W0), 0.325° (W1), 0.575° (W2), 0.825° (W3) and 1.075° (W4), respectively) from which the differential energy spectra were extracted. |
A differential energy spectrum extracted from the inner region (within a radius <0.8°) of Vela X is shown in Fig. 2 in red. The best approximation of the energy spectrum corresponds to an exponentially cut-off power-law function (dΦ(E)/dE = N0(E/1 TeV)−Γe − E/Ecut) with an index Γ = 1.36 ± 0.06stat ± 0.12sys, a cutoff energy Ecut = (13.9 ± 1.6stat ± 2.6sys) TeV and N0 = (11.6 ± 0.6stat ± 2.4sys) × 10-12 cm-2 s-1 TeV-1. The spectrum of the VHE γ-ray emission in the outer ring (between 0.8° and 1.2°) is drawn in black in Fig. 2. A photon index Γ = 1.14 ± 0.2stat ± 0.12sys, a cutoff energy Ecut = (9.5 ± 2.7stat ± 1.7sys) TeV and N0 = (3.28 ± 0.58stat ± 0.7sys) × 10-12 cm-2 s-1 TeV-1 are obtained for an exponentially cut-off power law. Since the ring spectrum derived is consistent with the one of the inner region, the total spectral shape of Vela X can be calculated from a 1.2° circular region around the central position. A fit to the spectrum of the entire Vela X region yields a spectral index Γ = 1.32 ± 0.06stat ± 0.11sys, Ecut = (14.0 ± 1.6stat ± 2.6sys) TeV and N0 = (14.6 ± 0.82stat ± 3.0sys) × 10-12 cm-2 s-1 TeV-1. A pure power-law fit is clearly disfavoured for all spectra by relatively high likelihood ratio values (>25) between the exponentially cut-off power-law and the power-law fit hypotheses. The results of the fits are summarised in Table 3.
In order to probe the hypothesis of potential radiative cooling of the electrons responsible for the IC origin of VHE γ-rays during their propagation away from the pulsar, a spectral softening is searched for in the H.E.S.S. data. To this end, spectra were extracted from a circular region with a radius of 0.2° around the position of the pulsar as well as from four ring sectors centred on the pulsar position and lying along the main axis of the VHE PWN (from north-west to south-east) at a radial distance of 0.3°, 0.6°, 0.8° and 1.1°, respectively, according to the hypothesis of advection of seed electrons. The regions (labelled W0 through W4; see Fig. 3 and insert therein) were chosen such that equivalent values of signal significance are achieved. A power-law fit limited to the energy range 0.75 to 10 TeV, disregarding the energy cutoff (because of the limited statistics of events at higher energy), was performed for each sector. This study yields compatible spectral indices included within 1.58 ± 0.15 and 1.67 ± 0.08 for all sectors but the one around the pulsar (W0) whose spectrum exhibits a photon index 1.35 ± 0.12 (see Fig. 3). Although some variation of the spectral index is found, the effect is limited to the immediate vicinity of the pulsar and is not statistically significant.
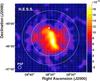 |
Fig. 4 H.E.S.S. VHE γ-ray surface brightness (cm-2 s-1 deg-2) of Vela X integrated between 0.75 TeV and 70 TeV and 0.07° Gaussian smoothing width. The 0.07° PSF achieved with the Xeff method applied in this analysis is also shown for comparison. The circles are drawn with radii of 0.8° and 1.2°, respectively, around the central position of the VHE γ-ray emission. The white star marks the position of the pulsar PSR B0833-45. |
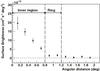 |
Fig. 5 VHE γ-ray averaged surface brightness around the central position. The error bars reflect the statistical uncertainties. The vertical lines mark the 0.8° and 1.2° radii of the outer ring region, which contains significant emission. |
3.2. Surface brightness
The surface brightness map of Vela X and its surroundings shown in Fig. 4 reveals one of the largest objects in the VHE γ-ray domain. The map was derived by comparing a measured particle rate (n) with an assumed reference spectrum (dN/dE). The best approximation of the differential energy spectrum, dN/dE ∝ E-1.36e−E/(13.9TeV) (resulting from the spectral analysis discussed in Sect. 3.1), has been assumed as reference spectrum in the calculation of the surface brightness map. For each run, a number of expected counts can be defined and results from the integration over a given energy range of the reference spectrum multiplied by the effective area (Ax,y):  (2)with T being the observation time of the run and Eth the threshold energy appropriate for the specific observation (0.75 TeV commonly applied to all observation runs in this analysis). The normalisation of the reference spectrum can be chosen arbitrarily since it will cancel out in the end. Several effects on the effective area Ax,y(E,θ,ρ,ϵ) are taken into account through its dependency on: a) the energy (E); b) the zenith angle (θ) of the telescope pointing direction; c) the offset (ρ) of the γ-ray trajectory to the pointing; d) the optical efficiency (ϵ) of the telescope reflectors.
The number of expected γ-ray counts (Gx,y) in each cell of the surface map (x,y) results from the sum of expected counts over all runs:  (3)Finally, the brightness Bx,y per each bin (x,y) of the map is calculated as the ratio of measured (nx,y) and expected events (Gx,y), weighted with the integral of the reference spectrum and divided by the solid angle of the integration region (sx,y) in the energy range where the spectral analysis is conducted (Eth = 0.75 TeV and EM = 70 TeV):
 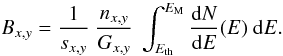 (4)The radial profile of the surface brightness is presented in Fig. 5. It has been extracted from the surface brightness map by averaging over concentric rings around the central position. The VHE signal stretches out to a radius of 1.2°. A residual excess which is not considered significant (≤ 3σ) is obtained over a larger radial extension (from 1.2° to 1.6°). Besides the strong signal in the inner region with a mean value of surface brightness of ~12 × 10-12 cm-2 s-1 deg-2, there is a weaker signal spread over the ring extension with a mean γ-ray flux of ~1.4 × 10⁻¹² cm-2 s-1 deg-2.
3.3. Morphology
The H.E.S.S. collaboration reported an intrinsic width of the VHE γ-ray flux profile from the Vela X region, fitted by a Gaussian function, of 0.48° in south-west to north-east direction and 0.36° in south-east to north-west direction (Aharonian et al. 2006a). In the following, this extent will be revisited using two perpendicular profiles through the central position with a width of 1.6° and a length of 4.0° (see Fig. 1). The line oriented 30° anticlockwise to north has been chosen as the axis for longitudinal slices (the major axis as in Fig. 1). This axis is in better agreement with the orientation of the spatial distribution of the VHE signal and is still close to the axis derived in the previous analysis (Aharonian et al. 2006a) so that the profiles can be compared. The filled black circles in Fig. 6 correspond to the VHE γ-ray surface brightness profiles along the two orthogonal axis.
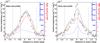 |
Fig. 6 VHE γ-ray surface brightness profiles for E > 0.75 TeV (filled black circles). The profiles through the central position are aligned parallel to the axis rotated 30° anticlockwise from the north, which is the major axis (left-hand panel, cf. Fig. 1), and perpendicular to this direction, along the minor axis (right-hand panel). Profiles of the radio flux at 2.4 GHz (Duncan et al. 1995) are drawn as red dashed lines, while X-ray data >1.3 keV (Aschenbach 1998) and after removing the bright emission at the pulsar position, are drawn as blue dotted lines. These profiles are scaled by the normalisation factors resulting from the best fit of the linear combination (see Eq. (5)) to the surface brightness map. Their sum, shown by black lines, is proposed as model for the VHE profiles. The corresponding absolute scales are shown on the right side of the plots in red for the radio flux and in blue for the X-ray data. The vertical lines mark the exterior borders of the ring extension (short-dashed lines) and the projected position of the pulsar within (dotted line). |
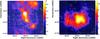 |
Fig. 7 Left-hand panel: X-ray kcounts/deg2 sky-map for energies E > 1.3 keV measured with ROSAT as from Aschenbach (1998) and Gaussian-smoothed with a radius of 0.07°. Note that the colour scale truncates the strong emission close to the pulsar at a level of 5 kcounts/deg2. Right-hand panel: radio sky-map at 2.4 GHz (Jy/Beam and half-power beam width of 0.17° measured) with the Parkes telescopes as from Duncan et al. (1995). White contours correspond to VHE γ-ray surface brightness of 0.3, 0.6, 1, 1.6 and 1.9 × 10⁻¹¹ cm-2 s-1 deg-2. |
The shape of the VHE γ-ray profiles along the major axis is well fit by a Gaussian function. The resulting width of (0.52 ± 0.02)° is compatible with the previously reported extent of (0.48 ± 0.03)°. Along the 120° direction (the minor axis in Fig. 1) the sum of a broad Gaussian component and a narrow Gaussian component describes the profile better. The two-component fit improves the χ2/d.o.f. from 48/15 to 5/12. The width of the broad component is (0.60 ± 0.04)°. The narrow component has a width of (0.12 ± 0.02)°. The extent of the minor axis profile was underestimated in the previous observations (Aharonian et al. 2006a).
A test for a point source component in VHE γ-rays from the pulsar position was conducted by the H.E.S.S. collaboration with the first VHE observations of Vela X (Aharonian et al. 2006a). This is repeated here with the new data. The γ-ray excess found at the pulsar position as a part of the extended emission (Fig. 4) has become more significant with respect to the previous observations. However, after subtraction of a Gaussian fit to the surface brightness within 0.1° from the pulsar the estimate of the residual γ-ray flux does not exhibit any significant point-like emission. Nevertheless, it should be noted here that the procedure of fitting the complex Vela X morphology with a simple Gaussian profile may bias the search.
4. Discussion
The new TeV data presented here allow us to readdress the question of whether the signal detected with H.E.S.S. corresponds to the X-ray cocoon as was thought in the past, or to the larger radio nebula. For a comparison with the X-ray features of Vela X a count map from the ROSAT satellite including events above 1.3 keV, as presented by Aschenbach (1998), is used2. In the X-ray count map, foreground emission (which may be mainly of thermal origin) covers the entire Vela X region with a width of ~2.5° in the east-west direction and spanning a region up to the edge of the SNR shell about 4° to the north of the pulsar. An emission level of 400 counts per deg2, morphologically compatible with the larger Vela SNR shell (Aschenbach 1998), is subtracted from the X-ray map. Residual thermal emission can still be present after the subtraction of a constant emission level and furthermore the map used for comparison may still miss fainter emission. As already mentioned the extension of the X-ray nebula is still an open question.
For comparison with data in the radio range, a survey of the Southern Galactic plane with the Parkes telescope at 2.4 GHz is used (from archival data; Duncan et al. 1995). The half-power beam width of the final radio map is 0.17°, which is slightly broader than the H.E.S.S. PSF.
In Fig. 7 the X-ray cocoon excess map from ROSAT data, smoothed with a Gaussian function of 0.07° rms width, and the Parkes radio map are shown together with VHE γ-ray surface brightness contours. Here we have shown that there is a clear VHE γ-ray signal up to 1.2°. In contrast to the former interpretation dating back to 2006, the morphology of this VHE γ-ray emission is intermediate between the X-ray cocoon and radio morphologies. This is also shown in Fig. 6 where the average brightness profiles of the X-ray map (blue line), excluding the bright compact emission within a circle of radius 6′ around the pulsar position, and the radio map (red line) are compared to the H.E.S.S. γ-ray surface brightness profiles (filled black circles). The profiles through the central position are aligned parallel to the major axis of Vela X (30° anticlockwise from the north), and parallel to the minor axis, respectively. Along the minor axis (right-hand panel of Fig. 6) the shape of the X-ray profile matches the central part of the VHE component. Hence, the putative narrow component may be a counterpart of the X-ray cocoon. At larger distance from the centre, however, the VHE minor axis profile has a broader extent than the X-ray cocoon. The radio profile is in reasonable agreement with the VHE profile along the two axes of Vela X. The X-ray cocoon emission peaks close to the pulsar outgoing to the south (at distance >0.3°), whereas the VHE and radio profiles do not. The VHE and radio emission maxima coincide (according to Fig. 6). This result raises doubts about the simple association of X-ray and VHE emission, and on the contrary suggests an association of the VHE and radio emission.
Typical approaches in modelling PWNe and in particular the favoured leptonic models discussed for Vela X assume effective parameters, i.e. the magnetic field and plasma density, averaged within one zone for the entire nebula volume and two distinct populations of electrons (Zhang et al. 2008; de Jager et al. 2008a). Assuming constant conditions implies that the spatial morphology of the X-ray and VHE γ-ray emission should match each other, as the emission is generated from the same leptonic plasma in synchrotron and IC processes. In order to test the assumption of constant conditions throughout the PWN and that both distinct populations of electrons contribute at the VHE emission, we investigate whether it is possible to describe the morphological structure measured in one wavelength regime with a linear combination of observations in other wavebands. More specifically, we consider a linear combination of the radio nebula mr(x) and the X-ray map mx(x) as a simple model of the VHE flux Sm(x):  (5)where a and b are location-independent linear coefficients and x is the position vector on the sky. By fitting Sm(x) to the surface brightness map the coefficients a = (1.3 ± 0.1) × 10-12 cm-2 s-1 deg-2 (Jy/Beam)-1 and b = (3.1 ± 0.3) × 10-15 cm-2 s-1 × counts-1 are obtained. This result suggests that ≃ 65% of the integrated γ-ray surface brightness is accounted for by a “radio-like” component and ≃ 35% by an “X-ray-like” component. In Fig. 6 the linear combination (black line) of the profiles of the X-ray map (blue line) and the radio map (red line) is presented and compared to the H.E.S.S. γ-ray profiles (filled black circles). The compatibility of the two-component model can be interpreted in two ways: i) the VHE morphology is intermediate between the X-ray and radio morphologies, plausible given the intermediate energies of the electrons probed by VHE IC emission; or ii) simply that both the radio nebula and X-ray cocoon features have VHE counterparts. Furthermore the overall consistency between IC and synchrotron emission suggests a relatively uniform B-field in the nebula on large spatial scales (outside filamentary structures), consistent with previous findings (de Jager et al. 2008a; Abdo et al. 2010).
The emission profiles show that along the major axis (i.e. along the main X-ray filament within the cocoon) the VHE γ-ray emission has a maximum at a radial distance of ~0.7° (corresponding to about 4 pc distance) from the X-ray maximum at the pulsar position. The difference in size between the γ-ray and X-ray cocoon emission regions can be attributed to the difference in energy of the electrons responsible for the radiation. For a few μG magnetic field only the most energetic electrons (many tens of TeV) emitted from the pulsar produce X-rays in the keV range. The electrons emitting VHE γ-rays, with characteristic cooling times of some kyr, are accumulated over a few kyr, convected over a larger distance and follow preferentially the B-field lines of the cocoon filament (de Jager & Djannati-Ataï 2009; Hinton et al. 2011). The outer region of the γ-ray emission seen by H.E.S.S. has a limited X-ray counterpart (mainly along the minor axis) while it is in good agreement with the radio emission. This implies that a second electron population which contributes to the radio emission could be also at the origin of VHE emission. Higher-resolution radio observations at 843 MHz performed with MOST (Bock et al. 1998) have shown a network of arc-like and loop-like filaments distributed over the Vela X region. They are interpreted as regions of enhanced matter density and/or localised sites of compression (i.e. amplification) of the magnetic field (Gvaramadze 1999). The correspondence between enhanced radio synchrotron emission filaments and VHE γ-rays emission is difficult to establish because of the limited angular resolution of H.E.S.S. compared to MOST. Furthermore, a correspondence between VHE γ-ray emission seen by H.E.S.S. and the radio filamentary structures with larger field strength (>5 μG) is difficult to explain since the electrons there would have even lower energy.
Under the assumption that two different electron populations contribute both at VHE one can expect very different VHE spectra for the two components while this situation is not verified. The formerly reported detection of VHE γ-ray emission in the inner test region has been confirmed in this work, including the spectral shape. The spectral shape of the VHE photon flux from Vela X follows a hard power law (Γ = 1.32) with an exponential cutoff (Ecut = 14 TeV). No significant spectral variations were found within Vela X and in particular between the cocoon and the outer part of the VHE emission region. Therefore, the first clear measurement of a peak in the SED (of very likely IC origin) at VHE energies applies not only to the cocoon but to the overall larger Vela X region. The absence of significant spectral variation of the non-thermal emission is surprising in most of the scenarios that have been developed for this object. The lack of an electron cooling signature suggests that particle escape and/or reacceleration may be playing a role. It could have an implication: the involved electron population originating from the accumulation of particles over several thousand years of the pulsar lifetime is modified by energy-dependent diffusive escape and possible stochastic re-acceleration. An injection of new electrons accelerated by the pulsar would explain a possible hardening of the spectral index near the pulsar, but this evidence is not established since the measured variation of the spectral index is not statistically significant. For the same reason the extent of Vela X emission was studied as a function of the energy: no definitive evidence of a radial energy-dependence of the source around the pulsar position is established.
No significant point-like emission at the pulsar position was found after subtraction of a Gaussian fit to the surface brightness of the extended emission. However, a significant brightness of the order of 10-11 cm-2 s-1 deg-2 is present at the pulsar position. A photon index of 1.35 ± 0.12 was obtained from a power-law fit in the energy range of 0.75 to 10 TeV within 0.2° from the pulsar position. Furthermore, the profile along the major axis (Fig. 6, left-hand panel) also indicates that the emission fades smoothly, extending to about 0.5° north of the pulsar.
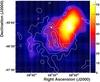 |
Fig. 8 Fermi-LAT Test Statistic (TS) map (adapted from Abdo et al. 2010) of off-pulse emission in the Vela region above 800 MeV. The measure of the statistical significance for the detection of a γ-ray source in excess of the background is |

The two distinct electron populations (according to the model by de Jager et al. 2008a) were also considered by the Fermi-LAT collaboration to interpret the Fermi-LAT Vela X observations. The first component responsible for the IC photon emission in the MeV/GeV energy range and the synchrotron emission at radio wavelengths is considered to interpret the excess seen by the Fermi-LAT in the energy range from 0.8 to 20 GeV observed in a region of the sky outside the Vela X cocoon (called halo) (Abdo et al. 2010). A second more energetic leptonic component would emit VHE γ-rays through IC scattering and X-rays of synchrotron origin. Two further pieces of evidence were presented to support this interpretation: 1) the SED is compatible with expectations based on the model and the morphological agreement between the Fermi-LAT (GeV) and WMAP (radio) data; 2) negligible VHE γ-ray emission from the same region of the sky as deduced by the previous H.E.S.S. observations of Vela X. In this scenario the Vela X emission detected by H.E.S.S. would originate only from the first leptonic component of the de Jager et al. (2008a) model. The results of the re-observation of Vela X with H.E.S.S. as described in this work reveal on the contrary that the two-population model needs to be revised since the region explored by Fermi-LAT (Fig. 8), called halo by the authors, is characterised also by a significant VHE γ-ray emission.
One alternative hypothesis to interpret the GeV and the VHE spectra is to infer different magnetic fields present in the region. In line with this hypothesis it is interesting that the time-dependent model recently proposed by Hinton et al. (2011) uses the present-day B-field in the extended radio nebula and a second B-field for the cocoon as free parameters. Unfortunately, the possibility to quantitatively support this hypothesis by means of a multiwavelength SED comparing the GeV and VHE γ-ray emissions is limited by the fact that the morphologies of the explored regions vary between the different wavebands as shown by the results of the work here reported. Finally, in this context it is worth recalling that the scenario is even more complicated when considering data from both AGILE and Fermi-LAT. When combined with the H.E.S.S. data, both show multiple peaks of potential IC origin in the SED, but the results obtained with the two instruments are incompatible with regard to morphology and spectra. The photon index measured with AGILE (~1.7) is harder than the one found by Fermi-LAT (~2.4). Furthermore, in contrast to the emission detected by Fermi-LAT, the source AGL J0834-4539 detected by AGILE in the energy range 100 MeV to 3 GeV is positionally coincident with HESS J0835–455 and has a brightness profile similar to the VHE Vela X morphology measured by H.E.S.S. (Pellizzoni et al. 2010).
In conclusion, revisiting the Vela X region with a refined analysis of its VHE γ-ray emission based on an enlarged data set demonstrates the puzzles often encountered in the interpretation of multiwavelength data when high-energy measurements are involved. At the same time, our study emphasises the relevance of the contributions of present and future VHE γ-ray IACT systems, with their large field of view and high sensitivity, to the understanding of the physics of PWNe.
Archival data: http://www.mpe.mpg.de/xray/wave/rosat/index.php
Acknowledgments
The support of the Namibian authorities and of the University of Namibia in facilitating the construction and operation of H.E.S.S. is gratefully acknowledged, as is the support by the German Ministry for Education and Research (BMBF), the Max Planck Society, the French Ministry for Research, the CNRS-IN2P3 and the Astroparticle Interdisciplinary Programme of the CNRS, the UK Science and Technology Facilities Council (STFC), the IPNP of the Charles University, the Czech Science Foundation, the Polish Ministry of Science and Higher Education, the South African Department of Science and Technology and National Research Foundation, and by the University of Namibia. We appreciate the excellent work of the technical support staff in Berlin, Durham, Hamburg, Heidelberg, Palaiseau, Paris, Saclay, and in Namibia in the construction and operation of the equipment.
References
- Abdo, A. A., Ackermann, M., Ajello, M., et al. 2010, ApJ, 713, 146 [NASA ADS] [CrossRef] [Google Scholar]
- Abramowski, A., Acero, F., Aharonian, F., et al. (H.E.S.S. Collaboration) 2012, A&A, 537, A114 [NASA ADS] [CrossRef] [EDP Sciences] [Google Scholar]
- Aharonian, F., Akhperjanian, A. G., Bazer-Bachi, A. R., et al. (H.E.S.S. Collaboration) 2006a, A&A, 448, L43 [NASA ADS] [CrossRef] [EDP Sciences] [Google Scholar]
- Aharonian, F., Akhperjanian, A. G., Bazer-Bachi, A. R., et al. (H.E.S.S. Collaboration) 2006b, A&A, 457, 899 [NASA ADS] [CrossRef] [EDP Sciences] [Google Scholar]
- Aharonian, F., Akhperjanian, A. G., Bazer-Bachi, A. R., et al. (H.E.S.S. Collaboration) 2006c, A&A, 449, 223 [NASA ADS] [CrossRef] [EDP Sciences] [Google Scholar]
- Aharonian, F., Akhperjanian, A. G., Bazer-Bachi, A. R., et al. (H.E.S.S. Collaboration) 2007, A&A, 661, 236 [Google Scholar]
- Alvarez, H., Aparici, J., May, J., & Reich, P. 2001, A&A, 372, 636 [NASA ADS] [CrossRef] [EDP Sciences] [Google Scholar]
- Aschenbach, B. 1998, Nature, 396, 141 [NASA ADS] [CrossRef] [Google Scholar]
- Aschenbach, B., Egger, R., & Trümper, J. 1995, Nature, 373, 587 [NASA ADS] [CrossRef] [Google Scholar]
- Bednarek, W., & Bartosik, M. 2003, A&A, 405, 689 [NASA ADS] [CrossRef] [EDP Sciences] [Google Scholar]
- Berge, D., Funk, S., & Hinton, J. 2007, A&A, 466, 1219 [Google Scholar]
- Bernlöhr, K., Carrol, O., Cornils, R., et al. 2003, Astrop. Phys., 20, 111 [CrossRef] [Google Scholar]
- Blondin, J. M., Chevalier, R. A., & Frierson, D. M. 2001, ApJ, 563, 806 [NASA ADS] [CrossRef] [Google Scholar]
- Bock, D. C.-J., Turtle, A. J., & Green, A. J. 1998, AJ, 116, 1886 [NASA ADS] [CrossRef] [Google Scholar]
- Bolz, O. 2004, Absolute Energiekalibration der abbildenden Cherenkov-Teleskope des H.E.S.S. Experiments und Ergebnisse erster Beobachtungen des Supernova-Überrests RX J1713.7-3946, Ph.D. Thesis, Ruprecht-Karls-Universität Heidelberg [Google Scholar]
- Caraveo, P. A., De Luca, A., Mignani, R. P., & Bignami, G. F. 2001, ApJ, 561, 930 [NASA ADS] [CrossRef] [Google Scholar]
- de Jager, O. C., & Djannati-Ataï, A. 2009, in Neutron Stars and Pulsars, ed. W. Becker, Springer’s Astrophys. Space Sci. Lib., 357 [Google Scholar]
- de Jager, O. C., Slane, P. O., & LaMassa, S. 2008a, ApJ, 689, L125 [NASA ADS] [CrossRef] [Google Scholar]
- De Naurois, M., & Rolland, L. 2009, Astrop. Phys., 32, 231 [Google Scholar]
- Dodson, R., Legge, D., Reynolds, J. E., & McCulloch, P. M. 2003, ApJ, 596, 1137 [NASA ADS] [CrossRef] [Google Scholar]
- Dubner, G. M., Green, A. J., Goss, W. M., Bock, D. C.-J., & Giacani, E. 1998, AJ, 116, 813 [NASA ADS] [CrossRef] [Google Scholar]
- Dubois, F. 2009, L’astronomie γ de très haute énergie avec H.E.S.S.: Développement d’une analyse multi-variables et application à l’étude de nébuleuses de pulsars, Ph.D. Thesis, Université de Savoie [Google Scholar]
- Dubois, F., Lamanna, G., & Jacholkowska, A. 2009, Astrop. Phys., 32, 73 [Google Scholar]
- Duncan, A. R., Stewart, R. T., Haynes, R. F., & Jones, K. L. 1995, MNRAS, 277, 36 [NASA ADS] [Google Scholar]
- Ferreira, S. E. S., & de Jager, O. C. 2008, A&A, 478, 17 [NASA ADS] [CrossRef] [EDP Sciences] [Google Scholar]
- Frail, D. A., Bietenholz, M. F., Markwardt, C. B., & Oegelman, H. 1997, ApJ, 475, 224 [NASA ADS] [CrossRef] [Google Scholar]
- Funk, S., Hermann, G., Hinton, J., et al. 2004, Astrop. Phys., 22, 285 [NASA ADS] [CrossRef] [Google Scholar]
- Gaensler, B. M., & Slane, P. O. 2006, ARA&A, 44, 17 [NASA ADS] [CrossRef] [Google Scholar]
- Gelfand, J. D., Slane, P. O., & Zhang, W. 2009, ApJ, 703, 2051 [NASA ADS] [CrossRef] [Google Scholar]
- Glück, B. 2011, A Detailed Study of the Pulsar Wind Nebula HESS J0835-455 (Vela X) in TeV γ-rays, Ph.D. Thesis, Universität Erlangen-Nürnberg [Google Scholar]
- Gvaramadze, V. 1999, A&A, 352, 712 [NASA ADS] [Google Scholar]
- Helfand, D. J., Gotthelf, E. V., & Halpern, J. P. 2001, ApJ, 556, 380 [NASA ADS] [CrossRef] [Google Scholar]
- Hillas, A. M. 1985, Proc. 19th ICRC (La Jolla), 3, 445 [Google Scholar]
- Hinton, J., Funk, S., Parsons, R. D., & Ohm, S. 2011, ApJ, 743, L7 [NASA ADS] [CrossRef] [Google Scholar]
- Horns, D., Aharonian, F., Santangelo, A., Hoffmann, A. I. D., & Masterson, C. 2006, A&A, 451, 51 [Google Scholar]
- Katsuda, S., Mori, K., Petre, R., et al. 2011, Astron. Soc. Jap., 63, S827 [NASA ADS] [Google Scholar]
- Large, I., Vaughan, A. E., & Mills, B. Y. 1968, Nature, 220, 340 [NASA ADS] [CrossRef] [Google Scholar]
- Lemoine-Goumard, M., Degrange, B., & Tluczykont, M. 2006, ApJ, 25, 195 [Google Scholar]
- Li, T., & Ma, Y. 1983, ApJ, 272, 317 [NASA ADS] [CrossRef] [Google Scholar]
- Lyne, A. G., Pritchard, R. S., Graham-Smith, F., & Camilo, F. 1996, Nature, 381, 497 [NASA ADS] [CrossRef] [Google Scholar]
- Lyons, L., Gibaut, D., & Clifford, P. 1988, Nucl. Instr. Meth. A, 270, 110 [NASA ADS] [CrossRef] [Google Scholar]
- Mangano, V., Massaro, E., Bocchino, F., Mineo, T., & Cusumano, G. 2005, A&A, 436, 917 [NASA ADS] [CrossRef] [EDP Sciences] [Google Scholar]
- Markwardt, C. B., & Ögelman, H. 1995, Nature, 375, 40 [NASA ADS] [CrossRef] [Google Scholar]
- Markwardt, C. B., & Ögelman, H. 1997, ApJ, 480, L13 [NASA ADS] [CrossRef] [Google Scholar]
- Mattana, F., Götz, D., Terrier, R., et al. 2011, ApJ, 743, L18 [Google Scholar]
- Milne, D. K. 1995, MNRAS, 277, 1435 [NASA ADS] [Google Scholar]
- Naumann-Godó, M., Lemoine-Goumard, M., & Degrange, B. 2009, Astrop. Phys., 31, 421 [NASA ADS] [CrossRef] [Google Scholar]
- Pavlov, G. G., Kargaltsev, O. Y., Sanwal, D., & Garmire, G. P. 2001, ApJ, 554, L189 [NASA ADS] [CrossRef] [Google Scholar]
- Pavlov, G. G., Teter, M. A., Kargaltsev, O., & Sanwal, D. 2003, ApJ, 591, 1157 [NASA ADS] [CrossRef] [Google Scholar]
- Pellizzoni, A., Trois, A., Tavani, M., et al. 2010, Science, 327, 663 [NASA ADS] [CrossRef] [PubMed] [Google Scholar]
- Piron, F., Djannati-Atai, A., Punch, M., et al. 2001, A&A, 374, 895 [NASA ADS] [CrossRef] [EDP Sciences] [Google Scholar]
- Rishbeth, H. 1958, Aust. J. Phys., 11, 550 [NASA ADS] [CrossRef] [Google Scholar]
- Weekes, T. C., Cawley, M. F., Fegan, D. J., et al. 1989, ApJ, 342, 379 [NASA ADS] [CrossRef] [Google Scholar]
- Weiler, K. W., & Panagia, N. 1980, A&A, 90, 269 [NASA ADS] [Google Scholar]
- Zhang, L., Chen, S. B., & Fang, J. 2008, ApJ, 676, 1210 [NASA ADS] [CrossRef] [Google Scholar]
All Tables
Various estimated contributions to the systematic error of the obtained flux and spectral index for this specific analysis.
Number Non of events in the test regions, the α factors, the number Nb of background events (corresponding to Noff × α), the resulting significance σ and the number of excess events Nγ for the On/Off background model.
Best fit results of the differential energy spectra extracted for the inner and the external ring test regions as well as integrating over the total Vela X extension.
All Figures
|
Fig. 1 Schematic overview of the region around Vela X. The star marks the position of the Vela pulsar PSR B0833-45. The light-grey area indicates the region 0.8° around the centre of the VHE γ-ray emission. The surrounding cross-hatched ring has an outer radius of 1.2°. The black dots mark the pointing positions that allow background estimation in reflected mode and which were chosen for the spectral analysis of the Vela X outer region (the cross-hatched ring). The line-filled rings are the associated reflected off-source regions. The two boxes are used to extract flux profiles (which are shown in Fig. 6), where the arrows indicate the direction of the slices (as explained in Sect. 3.3). The position of the nearby SNR Vela Junior (Aharonian et al. 2007) is also shown. |
| In the text | |
|
Fig. 2 Differential γ-ray spectrum of Vela X in the TeV energy range. Filled red circles: inner integration region <0.8°; open black circles: ring extension (between 0.8° and 1.2°). Both spectra are fitted with a power law with exponential cutoff. The shaded bands correspond to the statistical uncertainty of the fit. |
| In the text | |
|
Fig. 3 Spectral indices as a function of radial distance to the pulsar position along the major axis of Vela X. The insert shows a graphic of the five sectors on the sky-map (with radial distances of 0° (W0), 0.325° (W1), 0.575° (W2), 0.825° (W3) and 1.075° (W4), respectively) from which the differential energy spectra were extracted. |
| In the text | |
|
Fig. 4 H.E.S.S. VHE γ-ray surface brightness (cm-2 s-1 deg-2) of Vela X integrated between 0.75 TeV and 70 TeV and 0.07° Gaussian smoothing width. The 0.07° PSF achieved with the Xeff method applied in this analysis is also shown for comparison. The circles are drawn with radii of 0.8° and 1.2°, respectively, around the central position of the VHE γ-ray emission. The white star marks the position of the pulsar PSR B0833-45. |
| In the text | |
|
Fig. 5 VHE γ-ray averaged surface brightness around the central position. The error bars reflect the statistical uncertainties. The vertical lines mark the 0.8° and 1.2° radii of the outer ring region, which contains significant emission. |
| In the text | |
|
Fig. 6 VHE γ-ray surface brightness profiles for E > 0.75 TeV (filled black circles). The profiles through the central position are aligned parallel to the axis rotated 30° anticlockwise from the north, which is the major axis (left-hand panel, cf. Fig. 1), and perpendicular to this direction, along the minor axis (right-hand panel). Profiles of the radio flux at 2.4 GHz (Duncan et al. 1995) are drawn as red dashed lines, while X-ray data >1.3 keV (Aschenbach 1998) and after removing the bright emission at the pulsar position, are drawn as blue dotted lines. These profiles are scaled by the normalisation factors resulting from the best fit of the linear combination (see Eq. (5)) to the surface brightness map. Their sum, shown by black lines, is proposed as model for the VHE profiles. The corresponding absolute scales are shown on the right side of the plots in red for the radio flux and in blue for the X-ray data. The vertical lines mark the exterior borders of the ring extension (short-dashed lines) and the projected position of the pulsar within (dotted line). |
| In the text | |
|
Fig. 7 Left-hand panel: X-ray kcounts/deg2 sky-map for energies E > 1.3 keV measured with ROSAT as from Aschenbach (1998) and Gaussian-smoothed with a radius of 0.07°. Note that the colour scale truncates the strong emission close to the pulsar at a level of 5 kcounts/deg2. Right-hand panel: radio sky-map at 2.4 GHz (Jy/Beam and half-power beam width of 0.17° measured) with the Parkes telescopes as from Duncan et al. (1995). White contours correspond to VHE γ-ray surface brightness of 0.3, 0.6, 1, 1.6 and 1.9 × 10⁻¹¹ cm-2 s-1 deg-2. |
| In the text | |
|
Fig. 8 Fermi-LAT Test Statistic (TS) map (adapted from Abdo et al. 2010) of off-pulse emission in the Vela region above 800 MeV. The measure of the statistical significance for the detection of a γ-ray source in excess of the background is |
| In the text | |
Current usage metrics show cumulative count of Article Views (full-text article views including HTML views, PDF and ePub downloads, according to the available data) and Abstracts Views on Vision4Press platform.
Data correspond to usage on the plateform after 2015. The current usage metrics is available 48-96 hours after online publication and is updated daily on week days.
Initial download of the metrics may take a while.