Fig. 6
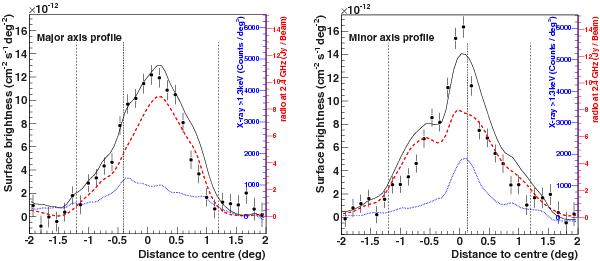
VHE γ-ray surface brightness profiles for E > 0.75 TeV (filled black circles). The profiles through the central position are aligned parallel to the axis rotated 30° anticlockwise from the north, which is the major axis (left-hand panel, cf. Fig. 1), and perpendicular to this direction, along the minor axis (right-hand panel). Profiles of the radio flux at 2.4 GHz (Duncan et al. 1995) are drawn as red dashed lines, while X-ray data >1.3 keV (Aschenbach 1998) and after removing the bright emission at the pulsar position, are drawn as blue dotted lines. These profiles are scaled by the normalisation factors resulting from the best fit of the linear combination (see Eq. (5)) to the surface brightness map. Their sum, shown by black lines, is proposed as model for the VHE profiles. The corresponding absolute scales are shown on the right side of the plots in red for the radio flux and in blue for the X-ray data. The vertical lines mark the exterior borders of the ring extension (short-dashed lines) and the projected position of the pulsar within (dotted line).
Current usage metrics show cumulative count of Article Views (full-text article views including HTML views, PDF and ePub downloads, according to the available data) and Abstracts Views on Vision4Press platform.
Data correspond to usage on the plateform after 2015. The current usage metrics is available 48-96 hours after online publication and is updated daily on week days.
Initial download of the metrics may take a while.