Fig. 7
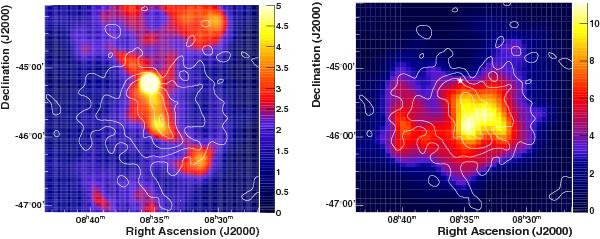
Left-hand panel: X-ray kcounts/deg2 sky-map for energies E > 1.3 keV measured with ROSAT as from Aschenbach (1998) and Gaussian-smoothed with a radius of 0.07°. Note that the colour scale truncates the strong emission close to the pulsar at a level of 5 kcounts/deg2. Right-hand panel: radio sky-map at 2.4 GHz (Jy/Beam and half-power beam width of 0.17° measured) with the Parkes telescopes as from Duncan et al. (1995). White contours correspond to VHE γ-ray surface brightness of 0.3, 0.6, 1, 1.6 and 1.9 × 10⁻¹¹ cm-2 s-1 deg-2.
Current usage metrics show cumulative count of Article Views (full-text article views including HTML views, PDF and ePub downloads, according to the available data) and Abstracts Views on Vision4Press platform.
Data correspond to usage on the plateform after 2015. The current usage metrics is available 48-96 hours after online publication and is updated daily on week days.
Initial download of the metrics may take a while.