Fig. 6
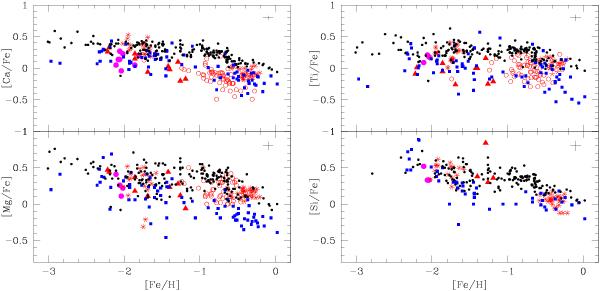
Abundances for α-elements compared to the literature. Magenta dots are our results for Hodge 11, in red the LMC data: triangles correspond to J06, open circles correspond to Pompéia et al. (2008), stars correspond to Mucciarelli et al. (2008) and M10. In black dots Galaxy data from Fulbright (2000) and Lee & Carney (2002), in blue squares data of dSph galaxies from Shetrone et al. (2001), Sbordone et al. (2007) and Monaco et al. (2005). Error bar stands for σtot from Table 2.
Current usage metrics show cumulative count of Article Views (full-text article views including HTML views, PDF and ePub downloads, according to the available data) and Abstracts Views on Vision4Press platform.
Data correspond to usage on the plateform after 2015. The current usage metrics is available 48-96 hours after online publication and is updated daily on week days.
Initial download of the metrics may take a while.