| Issue |
A&A
Volume 548, December 2012
|
|
|---|---|---|
| Article Number | A61 | |
| Number of page(s) | 11 | |
| Section | Interstellar and circumstellar matter | |
| DOI | https://doi.org/10.1051/0004-6361/201218975 | |
| Published online | 22 November 2012 | |
Dust coagulation processes as constrained by far-infrared observations
1 Institut d’Astrophysique Spatiale (IAS), Université Paris Sud & CNRS, Bât. 121, 91405 Orsay, France
e-mail: This email address is being protected from spambots. You need JavaScript enabled to view it.
2 L’Institut de Recherche en Astrophysique et Planétologie (IRAP), 9 Av. Colonel Roche, BP 4346, 31028 Toulouse, France
Received: 7 February 2012
Accepted: 24 September 2012
Abstract
Aims. We develop a simple model of coagulated dust particles of two sizes (3.5 and 60 nm radius) to understand the nature and the effects of coagulation, which could explain the evolution of the far-infrared (FIR) dust opacity observed in the transition between the diffuse and the dense interstellar medium (ISM) (nH > 103 cm-3).
Methods. Using the discrete-dipole approximation (DDA) method, we have calculated the absorption coefficient, directly proportional to the opacity, of coagulated grains with varying numbers of sub-grains and of different grain composition.
Results. We show that, in the transition from diffuse to dense clouds, an increase in the FIR opacity by a factor of about 2.7 is possible and a decrease in the grain temperature by up to 3−4 K can be explained by the presence of coagulated aggregates composed of four big grains and 4000 very small grains (40% of the volume of the BGs). The coagulation of very small grains into the aggregates leads to a decrease in the 60 μm emission.
Conclusions. This model can explain the observed increase in opacity at long wavelengths, the decrease in temperature from the diffuse ISM to denser regions with the coagulation of grains into aggregates and the absence of the 60 μm emission with the coagulation of very small grains onto the surface of the big grains.
Key words: ISM: general / dust, extinction / submillimeter: ISM
© ESO, 2012
1. Introduction
Far infrared (FIR) and sub-millimeter (sub-mm) observations of diffuse and molecular cloud environments (n > 102 cm-3), recently obtained with Herschel and Planck, and earlier with ISO, Spitzer, SPM/PRONAOS and IRAS, show variations in the emitting properties of the dust particles. Compared to the diffuse and atomic interstellar medium (ISM), where the dust temperature is typically 17.5 K (Boulanger et al. 1996), dust in denser regions of the ISM shows lower temperatures, e.g. 12.5 K (e.g. Lagache et al. 1998; Bernard et al. 1999; Stepnik et al. 2003; del Burgo et al. 2003; Planck Collaboration 2011b). Additionally, an increase in the dust opacity by a factor between 2 and 4 is observed in these denser regions at long wavelengths, which is inferred from the low dust temperature, and not always by comparison to the gas or AV (Bernard et al. 1999; Hotzel et al. 2001; Cambrésy et al. 2001; Stepnik et al. 2003; Bianchi et al. 2003; del Burgo et al. 2003; del Burgo & Laureijs 2005; Kiss et al. 2006; Lehtinen et al. 2007; Ridderstad et al. 2006; Bot et al. 2009; Paradis et al. 2009; Planck Collaboration 2011b). Moreover, the abundance of the very small grains (VSGs, 1 − 15 nm in radius), that are stochastically heated and responsible for the 60 μm emission, decreases by ~80–100% in the transition from diffuse to dense molecular clouds (Laureijs et al. 1991; Abergel et al. 1994, 1996; Lagache et al. 1998; Stepnik et al. 2003; Kramer et al. 2003). These observations cannot be explained only by the extinction of the local interstellar radiation field (ISRF; Bernard et al. 1999; Hotzel et al. 2001; Stepnik et al. 2003; Bianchi et al. 2003; Ysard et al. 2012).
The emission from dust in equilibrium with the radiation field can be calculated as a function of the wavelength λ using a single modified blackbody:  (1)where τλ is the wavelength-dependent dust optical depth, Bλ the Planck function, and T the dust temperature. The dust optical depth per unit column density defines the dust opacity1, σ(λ):
  (2)where NH is the column density.
The observed changes in the dust opacity at long wavelengths might be evidence for changes in the dust properties, suggesting that these changes occur due to the accretion of mantles (del Burgo et al. 2003; Kiss et al. 2006) and grain coagulation (Bernard et al. 1999; del Burgo et al. 2003; Stepnik et al. 2003; Kiss et al. 2006; Ridderstad et al. 2006; Paradis et al. 2009). Gas accretion forms grain mantles composed mainly of water ice and other molecular species (e.g. Mathis 1992; Whittet et al. 1996). Also, the coagulation of VSGs onto the surfaces of big grains (BGs, 15 − 110 nm in radius), which are in thermal equilibrium with the ISRF, can form a mantle (or rather, a porous mantle) around the BGs. Model calculations show that the formation of a thin mantle (thickness of 1/8 the grain’s radius) of amorphous carbon onto a silicate grain increases the dust absorption coefficient at 250 μm wavelength by a factor of up to about 1.9 compared to bare spherical grains (e.g. Köhler et al. 2011). This increase in the absorption coefficient corresponds to an increase in the opacity of about 1.3.
In denser regions of the ISM grains can coagulate into aggregates and dust model calculations show that this results in an increase in the dust opacity at long wavelengths, compared to single spherical grains (Wright 1987; Bazell & Dwek 1990; Fogel & Leung 1998; Ossenkopf 1993; Ossenkopf & Henning 1994). At mm wavelengths, Stognienko et al. (1995) found an increase of 1.2 − 1.3 in the absorption coefficient for aggregates of silicate and of 1.4 − 1.6 for aggregates of amorphous carbon, compared to single spherical grains, for grains in the Rayleigh regime and calculations with the discrete-dipole approximation (DDA, Purcell & Pennypacker 1973; Draine 1988; Draine & Flatau 2010). Köhler et al. (2011) found an even larger increase, of up to a factor of 2 at 250 μm, for aggregates of silicate compared to single isolated spherical grains; these results were also obtained for grains in the Rayleigh regime using DDA. The larger increase in the latter work results from a large contact area (nearly equal to the radius of the monomers) between the monomers, an effect which depends on the real part of the refractive index n (Köhler et al. 2011). Ormel et al. (2009, 2011) investigated the growth of aggregates in molecular clouds using an effective medium theory in combination with Mie theory. The authors find an increase in the opacity in the near and far infrared by a factor of 2 − 3 with the increasing size of the aggregates. This increase is due to the increase in porosity with aggregate growth. When adding ice to the material composition an increase in opacity was also observed (Ormel et al. 2009, 2011).
An increase in the dust absorption coefficient at long wavelengths is also observed for hollow spheres and porous particles compared to compact spherical grains (Jones 1988). It has also been shown that an elongated aggregate has a larger dust absorption coefficient than a more compact one (e.g. Henning et al. 1995; Stognienko et al. 1995).
These results show that, depending on the dust properties, e.g. the shape and structure of the aggregates and their material composition, the sub-mm opacity of aggregates can change significantly (Bazell & Dwek 1990; Ossenkopf 1993; Ossenkopf & Henning 1994; Stognienko et al. 1995; Dwek 1997; Fogel & Leung 1998; Köhler et al. 2011). Therefore, grain-grain coagulation into fluffy aggregates and the accretion of mantles around dust grains might explain the increase in the dust opacity observed in the transition from the diffuse to the dense ISM. The increase in the absorption coefficient at long wavelengths also results in a decrease in the temperature of the grains by about 2 − 3 K compared to isolated grains (Fogel & Leung 1998; Stepnik et al. 2003).
In this study we present a simple evolutionary model, which is consistent with coagulation time-scales. The evolution of matter can either occur due to the growth or destruction of grains or due to the changes in material composition. We here focus on the coagulation of grains into aggregates to investigate the growth of particles in the transition from the diffuse ISM to denser regions. We therefore calculate not only the absorption coefficient but also the temperature and emission of dust in the ISM respecting the cosmic abundances and the observed far-infrared spectral energy distribution (SED). In the dense regions of the ISM the grains are likely to coagulate into porous/fractal aggregates and the accretion of gas or the coagulation of small grains might occur at the same time or perhaps before coagulation. We therefore consider both coagulation and accretion processes. The goal of this paper is to investigate if the increase in opacity and the decrease in temperature observed from the diffuse ISM to the denser regions in the ISM are caused by the coagulation of VSGs and BGs into aggregates. The coagulation of small grains is equivalent to the accretion of a (porous) mantle onto the surface of the big grains. We will not consider an intrinsic β(T)-anti-correlation at long wavelengths in this study since this likely has a different origin (e.g. Meny et al. 2007; Coupeaud et al. 2011; Planck Collaboration 2011a). In a following paper we will investigate the influence of material in the transition from the diffuse ISM to denser regions.
The paper is organised as follows. In Sect. 2, we describe the models and the computational methods used to calculate the dust emission and opacity properties. In Sect. 3, we present the results of the model calculations. In Sect. 4, we discuss the results in terms of the opacity observed in dense molecular clouds and end with the conclusions in Sect. 5.
2. Dust model and computational methods
Dense molecular clouds are assumed to arise from the condensation of diffuse clouds. Models of the dust in the diffuse ISM are therefore critical for an understanding of the dust in dense clouds (Draine 1985) and its evolution. These models generally contain several dust components of differing chemical composition, structure and size (Draine & Lee 1984; Mathis 1990; Désert et al. 1990; Dwek et al. 1997; Li & Draine 2001; Draine & Li 2001; Zubko et al. 2004). In this work we have adopted the DustEM model (Compiègne et al. 2011) which has three separate dust components and which is consistent with the diffuse ISM dust extinction and emission:
-
Polycyclic aromatic hydrocarbons (PAHs): planar molecules(radii ~ 0.4−1.2 nm) responsible for the FUV extinction, the infrared aromatic emission features (3–30 μm) and the bump at 217 nm.
-
Very small grains (VSGs): three-dimensional amorphous carbonaceous grains (radii ~ 1.2−15 nm) responsible for the ~30−60 μm continuum emission.
-
Big grains (BGs): amorphous silicate grains and amorphous carbon grains (radii ~ 15−110 nm) responsible for the FIR to mm dust emission.
The PAHs and VSGs are both transiently heated by single photon absorptions and are out of thermal equilibrium with the ISRF (e.g. Sellgren 1984; Draine & Anderson 1985). The BGs are in thermal equilibrium with the ISRF and dominate the emission longward of ~70 μm. The exact heating regime (stochasitc vs. thermal equilibrium) for a given dust component depends on the intensity of the ISRF, the grain size and the heat capacity of the grains.
Figure 1 presents the SED of the diffuse ISM observed with DIRBE at 25, 60, 100, 140 and 240 μm and with FIRAS at wavelengths longer than 126 μm. These data sets are described in detail by Compiègne et al. (2011). We fit the observational data using DustEM (Compiègne et al. 2011). DustEM2 is a publicly available numerical tool to calculate the SED, the extinction and the grain temperature distribution for dust in the ISM. Any dust grain properties can be assumed. The ISRF is taken from Mathis et al. (1983) for a galacto-centric distance of DG = 10 kpc.
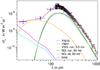 |
Fig. 1 Spectral energy distribution of the diffuse ISM determined with DustEM (Compiègne et al. 2011) for the dust model described in Table 1. The temperatures of the single grains are shown in Table 2. Observational data from FIRAS (black thin line with errorbars) and DIRBE (blue symbols); “car” indicates amorphous carbon and “sil” indicates astronomical silicate. |
To fit the observational data we assume two kinds of PAHs, neutral (PAH0) and single charged (PAH1), for more detail see Compiègne et al. (2011), VSGs and two kinds of BGs. Compiègne et al. (2011) find the best fit to the observational data of the emission and extinction when assuming a size distribution for the different components. We assume a simpler model since for the BGs and the VSGs we chose a single grain size instead of a size distribution. For the PAHs we adopt the size distribution from Compiègne et al. (2011). This approach does not provide a realistic description of the dust particles in the diffuse ISM since the size of the grains realistically follows a size distribution, as is demonstrated by the shape of the extinction curve that we cannot fit with our simple model. However, this simple model does allow us, in the following, to build simple aggregates which consist of one size of BGs and one size of VSGs and to compare the results easily. For the material composition we assume that BGs consist of astronomical silicate (Draine & Lee 1984) (ρ = 2.5 g cm-3) and amorphous carbon AC1 (ρ = 1.81 g cm-3, Rouleau & Martin 1991) and VSGs consist of amorphous carbon AC1. We consider an elemental abundance for silicon relative to hydrogen of 32 ppm which is in agreement with Compiègne et al. (2011). The elemental abundance of carbon relative to hydrogen is determined when fitting the observational data. With these assumptions the best fit to the dust emission observational data is obtained with BGs with a radius of 60 nm and VSGs of 3.5 nm (see Fig. 1). The elemental abundance of carbon relative to hydrogen is 255 ppm (63 ppm for VSGs, 127 ppm for BGs and 65 ppm for PAHs) which agrees with the normally considered elemental abundance of 269 ppm relative to hydrogen (e.g. Compiègne et al. 2011). In Table 1 the properties of the considered PAHs, VSGs and BGs are given. Since PAHs do not contribute to the SED at wavelengths longer than 30 μm we do not consider them in the following calculations.
Based on this simple model we will calculate the optical properties of aggregates where the monomers consist of BGs and VSGs with radii of 60 nm and 3.5 nm, respectively. The number of VSGs per BG can be obtained from the masses used to fit the observed SED and is ~1000 VSGs per BG.
2.1. Light-scattering theories
The model calculations are carried out using the DDA code DDSCAT (for a detailed description see Draine 1988; Draine & Flatau 2010) including the lattice dispersion relations (LDR; Draine & Goodman 1993), hereafter referred to as DDA, which has the advantage that the contact area between the monomers can be controlled and is not point-like (Köhler et al. 2011). As was shown by Köhler et al. (2011), the optical properties of an aggregate depend strongly on the connection between the monomers. Draine & Flatau (2010) indicate that their code gives accurate results for | m − 1 | ≲ 2. However, Yurkin et al. (2010) show that DDA does converge for higher refractive indices (|m − 1 | > 2), for particles in the Rayleigh regime, but that the calculations are computationally expensive.
We use astronomical silicate (Draine & Lee 1984) and amorphous carbon (AC1; Rouleau & Martin 1991) for the material of the BGs. Astronomical silicate has a real part of the refractive index n = 3.4 at wavelengths longer than 240 μm and is actually outside the DDA validity limit of | m − 1 | ≲ 2. It was shown by Köhler et al. (2011) that for a single spherical BG of astronomical silicate the deviations between the results with DDA, as used here, and the results obtained with Mie theory (Mie 1908) are small ( < 8%) so that astronomical silicate can still be used for the DDA calculations. For amorphous carbon (AC1) we are inside the DDA validity limit of | m − 1 | ≲ 2. The second validity criteria for DDA is that the number of dipoles has to bee chosen so that the dipoles are smaller than the wavelength inside and outside the material:  and
and  . For BGs of astronomical silicate and amorphous carbon these criteria are valid for all wavelengths larger than 0.045 μm.
When assuming aggregates of BGs and VSGs, the BGs are 17 dipoles across the diameter and the contact area between the BGs is 7 dipoles across. This allows us to consider one dipole for one VSGs inkeeping with the size ratio3.
We additionally consider bare coagulated BGs. We decrease the number of dipoles per BG to 11 dipoles across the diameter and the contact area is 5 dipoles across. This allows a relatively fast calculation of the optical properties of the aggregates for up to 16 BGs.
We average all of our considered aggregate structures over 125 orientations, which allows for a relatively fast calculation and gives sufficient accuracy. The results with 125 (5 × 5 × 5) orientations deviate by less than 1% from those with 4 × 4 × 4 orientations so we can conclude that convergence is reached.
PAH, VSG, and BG radii, mass, elemental abundance, and composition for our three-grain model.
2.2. Aggregates
We consider aggregates of BGs and VSGs. The BGs and VSGs are assumed to be spherical, although for the DDA calculations VSGs are cubic when assuming only 1 dipole. The BGs are connected into aggregates on a cubic grid in order to control the contact surfaces (e.g. Köhler et al. 2011). The VSGs are then randomly arranged on the surface of the BGs in positions no further than two layers from the surface of the BG in order to avoid VSGs building chains which can act like antennae. The VSGs are connected to the faces of the dipoles of the BGs or to other VSGs, so that the distance between the dipoles is constant. An example of an aggregate with 4 BGs and in total 4000 VSGs (40% of the volume of the BGs) is shown in Fig. 2. At long wavelengths the size of the aggregates is in all cases much smaller than the wavelength so that the calculations are carried out in the Rayleigh regime. Therefore in our studies, the changes resulting from coagulation are dependent on the particle shape rather than its size. The influence of different shapes on the dust emission was discussed in Henning et al. (1995) and Köhler et al. (2011). We here show an intermediate shape (between a row and a square of 4 BGs) that will be used for the following calculations when aggregates with 4 BGs are assumed.
With these calculations we investigate the case that BGs coagulate into aggregates and VSGs coagulate (as a kind of a mantle) on the surface of the aggregates. The other possibility would be to coagulate VSGs first and then connect the mixed BG/VSG particles into aggregates. In the latter case the contact between the BGs might change in size and in material composition compared to the first case, this would result in a smaller increase in Qabs (Köhler et al. 2011) and we not follow this approach.
We consider different grain structures: single grains, aggregates of 4 and 16 bare BGs, a single BG with a variable number of VSGs coagulated on its surface and aggregates of 4 and 16 BGs with a total of 4000 and 16 000 VSGs, respectively, on their surfaces. The shape of the aggregates with 4 BGs is shown in Fig. 2 and for the aggregates with 16 BGs we choose an aggregate with a fractal dimension of 2.0 (for details see Köhler et al. 2011). Note that a fractal dimension is not applicable for aggregates with a small number of monomers (e.g. Jones 2011) but we have constructed the aggregate using the method in Köhler et al. (2011) where a fractal dimension has to be given. It was shown by Mackowski (2006) that the increase in absorption coefficient saturates for aggregates with more than a few grains for small n and k and a few tens of monomers for larger n and k. For monomers of astronomical silicate Köhler et al. (2011) showed that the increase in the absorption coefficient is large up to aggregates of 4 BGs and then starts to saturate for larger aggregates of a similar elongation.
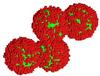 |
Fig. 2 Aggregate with 4 BGs and 4000 VSGs in total (40% of the volume of the BGs). The shape is one of the aggregates considered in the model calculations. Each cube represents one dipole. Red cubes indicate VSGs and green cubes BG dipoles. |
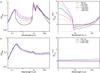 |
Fig. 3 λQabs (left) and |
2.3. Materials
In this paper we focus on the changes in opacity with changes in the grain shape due to coagulation processes. In a following paper we will investigate in detail the influence of material evolution from the diffuse ISM to denser regions. In this study, we therefore consider the same materials for grains in the diffuse ISM and for the denser regions. It is assumed that dust particles in the ISM consist of silicate and carbonaceous material (e.g. Mathis et al. 1977; Draine & Lee 1984; Kim et al. 1994; Kim & Martin 1995; Li & Greenberg 1997). Observations, coupled to modelling, show that the silicates occur in amorphous form (e.g. Kemper et al. 2004). We adopt the optical constants of astronomical silicate derived by Draine & Lee (1984). We further consider the optical constants of PAH neutral and charged. For VSGs and BG of carbonaceous material we consider the optical constants of amorphous carbon (AC1) that are measured up to a wavelength of 300 μm (Rouleau & Martin 1991) and extrapolated with a power-law for longer wavelengths.
3. Model results
In this section we present and analyse the results of the model calculations of the absorption coefficient Qabs and the temperature of the aggregates. We present results for a single BG, for coagulated BGs, for a single BG with coagulated VSGs and for coagulated BGs with VSGs. Aggregates of silicate-only BGs, carbon-only BGs and mixed BGs are also considered.
For normalisation we calculate the absorption cross section  and divide by the total volume, V, of the aggregate. The radius of the volume-equivalent spheres, aV, of the aggregate is given by:
 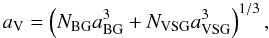 (3)where NBG and NVSG are the number of BGs and VSGs in an aggregate, respectively, and aBG = 60 nm and aVSG = 3.5 nm are their radii. We then normalise Cabs/V to
  , where
  is the absorption cross section and Vsph is the volume of one BG forming the aggregate as per Köhler et al. (2011). This normalisation is valid for aggregates where the BGs consist of only one material. The normalised result is indicated by:
 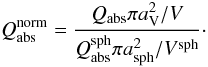 (4)For “mixed” aggregates consisting of BGs of amorphous carbon and of astronomical silicate we calculate
  , the absorption cross section for the isolated BGs that form the aggregates, and calculate the total volume of the separated BGs, Vsep. The normalised result for these “mixed” aggregates is given by:
 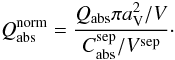 (5)The normalisation directly shows the increase due to the coagulation of BGs into an aggregate and the coagulation of VSGs on the surface of the BGs. Note that, for the submm emission, VSGs are essentially “free” material because their emission is negligible at these wavelengths when separated from aggregates.
3.1. Sticking VSGs on one BG
 |
Fig. 4 One BG with 250, 500, 1000, 1500 and 2000 VSGs (from left to right). Each cube represents one dipole, green cubes indicate the BG dipoles and red cubes the VSG dipoles. |
In a first step we investigate the variations in Qabs by adding VSGs of amorphous carbon onto the surface of a single BG, i.e. forming a mantle around the BG. This process corresponds to the coagulation of VSGs onto the surface of BGs, while in the next section we investigate the coagulation of BGs and VSGs into aggregates. The calculations are carried out with DDA and the results are shown in Fig. 3 where λQabs (left) and  (right) are shown. We consider 250, 500, 1000, 1500 and 2000 VSGs located within two dipole layers on the surface of a BG (see Fig. 4). The number of VSGs correspond to 10%, 20%, 40%, 60% and 80% of the volume of the BG, respectively. If we assume within our simple model that all VSGs are coagulated onto the surfaces of BGs, then on average ~1000 VSGs (40% of the volume of the BG) stick onto the surface of a single BG. For BGs of astronomical silicate, increases slightly at short and long wavelengths and decreases in the ~8−100 μm wavelength range as the number of VSGs increases when up to 1000 VSGs (40% of volume of the BG) are coagulated (blue line in Fig. 3a). For aggregates with 1500 and 2000 VSGs decreases compared to aggregates with fewer VSGs for wavelengths longer than about 8 μm, while at shorter wavelengths increases with increasing number of VSGs. These changes in as a function of the number of VSGs are shown in Fig. 5 for λ = 250 μm. Different distributions of VSGs on the surface of the BG result in deviations of less than 5%.
The increase in Qabs with up to 1000 VSGs on a BG occurs because of the addition of extra material and the effect of changes in the grain shape by making the grain more irregular. For aggregates with up to 1000 VSGs, the VSGs are randomly distributed on the surface of the BG and the aggregate has an irregular shape (see Fig. 4). With a larger number of VSGs the two outer dipole layers of VSGs around the BG are nearly filled, a mantle of amorphous carbon is formed around the BG resulting in a more regular grain and Qabs decreases compared to the more irregularly shaped grains. This can clearly be seen in Figs. 4 and 5.
For carbon BGs the effect of accreting VSGs at the surface, akin to increasing the surface irregularity, leads to much smaller effects with an increase of, at most, 16% (see Fig. 3b).
We carried out further model calculations to study the influence of grain shape irregularity, where we consider an initially spherical grain, 13 dipoles across and composed of astronomical silicate. Dipoles are removed randomly from the surface of the grain and replaced on the surface so that they connect to the face of another dipole, not further than 2 layers of dipoles away from the original surface to avoid antenna effects. The more dipoles that are displaced, i.e. the more irregular the surface of the grain, the larger is the increase in Qabs. We find that a maximal increase in Qabs of ≈ 17% is reached compared to a spherical particle constructed with DDA. This increase in Qabs with increasing irregularity arises from a depolarisation effect (for details see Henning et al. 1995). It should be noted that “real” grains in the diffuse ISM are most probably irregular, so that the calculated increases in Qabs for a single grain should actually be reduced, by at most 17%, for comparison with the observational data in this study in order to account for the effects of grain shape irregularities. The optical properties of aggregates consisting of irregularly-shaped BGs will need to be studied in detail in order to understand the influence of monomer shape on Qabs. In this study we therefore only consider spherical BGs.
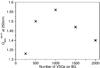 |
Fig. 5
|
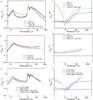 |
Fig. 6 λCabs/V (left) and |
3.2. Coagulation of BGs and VSGs
In these calculations, we form aggregates of BGs and add VSGs onto the BG surfaces, and only consider 1000 VSGs per BG (40% of the volume of the BG). We consider aggregates of 4 and 16 BGs with VSGs and additionally aggregates of 4 and 16 bare BGs. For aggregates with 4 BGs we consider three different cases: 1) all BGs consist of astronomical silicate, 2) all BGs consist of amorphous carbon, and 3) 1 BG is of amorphous carbon and 3 BGs of astronomical silicate (indicated as “mixed” aggregates in the following). For aggregates consisting of 16 BGs we only consider two cases: 1) all BGs consist of astronomical silicate and 2) the “mixed” case where 4 BGs consist of amorphous carbon and 12 BGs of astronomical silicate. In Fig. 6λQabs (left) and  (right) for these aggregates are shown over a wide wavelength range. The values of at λ = 250 μm are listed in Table 2 (second column).
For BGs composed of astronomical silicate (Fig. 6a), it can be seen that Qabs is larger for aggregates with 4 and 16 BGs (blue and green line, respectively) than for a single grain (black line) for all wavelengths except for the region of the silicate features occurring at ~10 and ~18 μm. For these aggregates is nearly constant 1.8 and 2.2, respectively, at wavelength longward of ~70 μm. The similar values of indicate a saturation of the increase which was expected and is in agreement with results shown by Mackowski (2006) and Köhler et al. (2011). Adding VSGs onto the surfaces of the 4 BGs forming an aggregate leads to a further increase in Qabs at shorter wavelengths and at wavelengths longer than 200 μm (red line). The results clearly show that coagulating grains of one material does not change the slope of the Qabs curve, only when coagulating grains of different materials does the slope change due to the mixing of materials.
For aggregates with 4 BGs of amorphous carbon (Fig. 6b), is in general smaller than for aggregates with 4 BGs of astronomical silicate, except in the 8 − 60 μm wavelength range where the silicate features occur. When adding VSGs on the surfaces of amorphous carbon BGs increases of about 8% for the entire wavelengths range are seen, compared to aggregates of bare BGs of amorphous carbon.
For composite aggregates of 3 BGs of astronomical silicate and 1 BG of amorphous carbon (Fig. 6c, blue line), a clear increase in Qabs at all wavelengths, outside of the strong silicate resonances, is observed compared to the well separated BGs of astronomical silicate and amorphous carbon forming the aggregate (black line). When adding in total 4000 VSGs an additional increase in Qabs occurs at wavelengths longer than about 110 μm (red line). Assuming aggregates with 16 BGs, with 4 BGs of amorphous carbon and 12 BGs of astronomical silicate, and in total 16 000 VSGs (40% of the volume of the BGs) the increase in Qabs is only slightly larger (around 6% at 110 μm) (cyan line).
3.3. Calculating the temperature, emission and opacity of aggregates with DustEM
In this section we determine the dust temperature, emission and opacity of the aggregates using DustEM.
We assume 1000 VSGs per BG so that there are no remaining VSGs which are not coagulated onto BGs. We distinguish between two cases: 1) two components: aggregates of astronomical-silicate BGs and aggregates of amorphous-carbon BGs. The SEDs are calculated separately for these two components and are then added to obtain the total SED. This case is unlikely for our simple model since mixing of BGs of different materials would occur and it is only shown for comparison; 2) one component: the BGs in an aggregate are of amorphous carbon and astronomical silicate with 1 BG of amorphous carbon and 3 BGs of astronomical silicate, which is the most likely case of statistical mixing for our simple model. We calculate the SED of this mixed aggregate.
To determine the difference in grain temperature due to coagulation of BGs and the coagulation of VSGs we use the same ISRF from Mathis et al. (1983) for a galacto-centric distance of DG = 10 kpc as for the results shown in Fig. 1. The calculated dust temperatures are shown in Table 2 (third column). Single BGs of amorphous carbon and astronomical silicate have temperatures of 18.1 and 16.3 K, respectively which is consistent with the average dust temperature in the diffuse ISM derived from the observed SEDs. The VSGs are stochastically heated and reach maximal temperatures of ~150 K. The dust temperature is in general lower when the BGs are coagulated into aggregates. The addition of VSGs onto the surface of the BGs of astronomical silicate increases the temperature due to the addition of an absorbing material. For the BGs of amorphous carbon the temperature decreases with the addition of VSGs, since the size of the grain increases without changes in the material composition. Aggregates consisting of 3 BGs of astronomical silicate and 1 BG of amorphous carbon show an intermediate temperature of 14.8 K, which is only slightly increased by the addition of VSGs. In general a decrease in the dust temperature occurs for an increase in the number of BGs in an aggregate: the dust temperatures are 16.3 K, 14.0 K and 13.5 K for a single BG, for aggregates of 4 bare BGs and for aggregates of 16 bare BGs of astronomical silicate. With changes in the ISRF, with G0 varying between 0.1 and 10, dust temperatures between 10 and 27 K can be reached, depending on the material composition and coagulation state (see Fig. 8, left).
at λ = 250 μm, the dust temperature and the increase in the dust opacity (indicated as τnorm) at λ = 250 μm assuming the ISRF for the diffuse ISM.
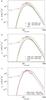 |
Fig. 7 Spectral energy distribution (SED) calculated with DustEM for coagulated grains (solid lines): a) 1 BG plus 1000 VSGs, b) 4 BGs plus in total 4000 VSGs (two components) and c) 4 BGs plus in total 4000 VSGs (one component). The dashed lines indicated the calculated SED of the diffuse ISM determined with DustEM for single grains as in Fig. 1 before coagulation (dashed lines). The symbols indicate the observations of the diffuse ISM as shown in Fig. 1; “car” indicates amorphous carbon and “sil” indicates astronomical silicate, “mixed” indicates aggregates with 4 BGs, where 1 BG is of amorphous carbon and 3 BGs of astronomical silicate, and of 16 BGs, where 4 BGs are of amorphous carbon and 12 BGs of astronomical silicate. |
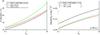 |
Fig. 8 The variations in temperature (left) and intensity at 250 μm (right) due to changes in the ISRF, G0, are shown for different grains. |
The changes in the SED due to the coagulation of grains are shown in Fig. 7. Since all VSGs are coagulated on the surface of the BGs the SED is strongly reduced at 60 μm, which is in agreement with the observations (not shown in Fig. 7). At λ = 250 μm the increase in the dust emission is 1.60 for single BGs with VSGs (two components), 1.78 for aggregates of 4 BG with VSGs (two components) and 1.68 for aggregates of mixed 4 BGs with VSGs (one component). No additional increase in the emission occurs for mixed aggregates of 16 BGs. The changes in intensity, for an ISRF with G0 between 0.1 and 10, are shown in Fig. 8, right. The results show that the main increase results from the coagulation of the BGs, where an increase of 2.0 is reached when coagulating 3 BGs of astronomical silicate and 1 BG of amorphous carbon. Adding VSGs to the surface of these coagulated BGs results in an increase that is only 23%. Therefore the role of the VSGs in the opacity enhancement is rather minor but their disappearance is necessary to explain the reduced 60 μm emission observed in dense regions.
The opacity variations are shown in Table 2 (fourth column) for λ = 250 μm. Increases of ~2.6 and ~2.7 can be reached when coagulating 4 BGs and 4000 VSGs and 16 BGs and 16 000 VSGs, respectively, into aggregates. This result again shows that the coagulation of 4 BGs into aggregates already gives a large increase in the opacity and that the additional increase is small for larger aggregates. An interpretation of the PRONAOS observations in the Taurus region by Stepnik et al. (2003) show an increase in τ250 μm/NH of 3.5 and a dust temperature of 12 K. The increases that we obtain for our considered aggregates are slightly smaller than 3.5 and the temperatures are slightly larger than 12 K. Observations with Planck give an increase in τ250 μm/NH of around 2 from the atomic to the molecular phase, which would be in the range of the increase we obtain by coagulating BGs and VSGs. However, this result was obtained by neglecting radiative transfer effects which might lead to a larger increase (Ysard et al. 2012). The temperature of the dust decreases from 16 − 17 K in the diffuse ISM to 13 − 14 K in denser regions (Planck Collaboration 2011a), which is in agreement with our model.
In order to calculate the SED including the ISRF of the denser regions of the ISM, a detailed study of the radiative transfer has to be carried out, which will be presented in a following paper.
4. Discussion
In this section we discuss the influence of the grain properties and the coagulation time scales on the optical properties of the dust grains.
4.1. Dependence on aggregate properties
The absorption coefficient Qabs depends strongly on the grain properties: the number of VSGs, the optical constants of the materials, the structure or the shape of the aggregates and the contact area between the monomers (Köhler et al. 2011).
We adopt the elemental abundances of Compiègne et al. (2011), which are consistent with the observational results for the diffuse ISM, assuming that all of the silicon is in silicate grains and nearly all of the carbon in amorphous carbon grains. Variations of the elemental abundances in Si and C mostly have a scaling effect on the SED at long wavelengths.
Adding more VSGs would not necessarily result in a larger increase in Qabs at long wavelengths as shown in Sect. 3.1 and in Fig. 3. In this study we constrain the VSGs to be located only in two layers on top of the surface of the BGs in order to avoid any antenna effect. A larger increase in Qabs can be obtained when arranging the VSGs in such a way that they form rod-like structures on the BG, so that an antenna effect occurs. A larger increase in the dust opacity (~3.4) can be achieved with aggregates of 4 mixed BGs where the VSGs are coagulated in this way to form antennae 5 VSGs in length. Whether this arrangement of amorphous-carbon VSGs is physically correct is questionable and so we do not pursue this approach.
Assuming a smaller fractal dimension for an aggregate results in a more elongated shape which leads to an increase in the antenna effect and therefore an increase in Qabs (Henning et al. 1995). For aggregates with only a small number of BGs a characterisation using the fractal dimension is not really applicable (e.g. Jones 2011). The description of an aggregate using the fractal dimension should therefore only be applied for larger aggregates (actually 16 BGs are still too small). For the case of aggregates consisting of a larger number of BGs an increase in Qabs can be observed by decreasing the fractal dimension. Regarding the coagulation time-scales not more than 25 BGs can be coagulated in a typical cloud lifetime (see Sect. 4.2).
As demonstrated by Köhler et al. (2011) the size of the contact area between the monomers of an aggregate influences Qabs and therefore the SED at long wavelengths. The influence of contact area needs to be taken into account for dust in the denser regions of the ISM. In the presented study we assumed BGs of 17 or 11 dipoles across the diameter and a contact area between the BGs of 7 and 5 across the diameter, respectively. These contact areas give the maximal increase in Qabs, as presented by Köhler et al. (2011). Compared to a point-contact between 2 monomers a maximal increase of 1.4 can be reached for the optimal contact area, in the case of 4 monomers this increase is around 2.
The results for the calculations depend on the choice of the optical constants of amorphous carbon. It is assumed that amorphous carbon will occur in a hydrogen-poor state and the amorphous carbon that we assume in this study as hydrogen poor AC1 type. The absorption coefficient for single grains of different amorphous carbons shows different behaviours over the entire wavelength range. A new study by Jones (2012a,b) discusses the differences in the different sets of the optical constants of amorphous carbon. In a following paper we will study the evolution of matter from the diffuse ISM to denser regions by considering the evolution of the grain material. We will further include ice, since an increase in the opacity was observed by Ormel et al. (2011) when adding ice to the material composition.
The assumed material in this study, amorphous carbon AC1 from Rouleau & Martin (1991), has the advantage that it can be included in the DDA calculations, which is not the case for other amorphous carbons (see Sect. 2.3). The optical constants of other amorphous carbons can be included in other light-scattering theories, but then the influence of the contact area on Qabs cannot be studied (see Köhler et al. 2011). Unfortunately the optical constants of amorphous carbon AC1 from Rouleau & Martin (1991) are only measured up to 300 μm and are extrapolated at longer wavelengths. The extrapolation can clearly be seen in the bend in Qabs at 300 μm. Since we are interested in the results at λ = 250 μm in order to compare them with results from Stepnik et al. (2003) we can use the results of Qabs where the optical constants are measured. But in order to calculate the SED, the dust temperature has to be calculated for Qabs over the entire wavelengths range considered. Due to the extrapolation of the optical constants at wavelengths longer than 300 μm the SED might deviate from the SED with “real” optical constants. Assuming another extrapolation which does not result in a bend at 300 μm, the deviations in the SED occur mainly at wavelengths longer than 400 μm and do not influence the results at 250 μm. The temperature of the BGs of amorphous carbon decreases then by 0.01 K and the maximal temperature of VSGs is 135 K instead of 157 K. Since the latter is due to stochastic heating and the temperature changes for BGs are small, no shifts in the maxima of the SED occur.
For the calculations with DustEM we consider a two-grain model with VSGs of 3.5 nm and BGs of 60 nm. In general a size distribution is much more realistic than single grain sizes but in order to control the shape and structure of aggregates we restrict our study to a simple model assuming only two grain sizes. When assuming a size distribution it is much more likely that a smoother mantle will be formed than is the case for only single-size coagulating particles.
4.2. Dependence on coagulation time-scales
Table 3 presents the number density of the grains, ng, and the time-scales for two-grain coagulation, for the different processes presented in the previous section. We have used the hypothesis and the equations described in the work by Stepnik et al. (2003). The critical velocity for sticking is assumed to be 0.1 km s-1 (Draine 2004). Table 3 gives the estimates but the important point is that the coagulation time-scale for one VSG onto one BG is smaller by two orders of magnitude than any of the other time-scales.
Obviously, the coagulation time-scale must be smaller than the molecular cloud lifetime. A typical cloud lifetime estimated from the cloud free-fall time is 106–107 years (e.g. Walmsley 1991). Very roughly, the time-scale to coagulate 4 BGs is equal to ~3 times the time-scale to coagulate 2 BGs. So, the time-scale to coagulate aggregates with 4 BGs of astronomical silicate is of the order of 1.3 × 10⁶ years and to coagulate aggregates with 4 BGs of amorphous carbon is about 3.3 × 10⁶ years, which is within the cloud lifetime. It is therefore likely that aggregates with 4 or even more BGs are formed, where the limit is around 23 BGs of astronomical silicate and 9 BGs of amorphous carbon assuming a cloud lifetime of 107 years. During this time many VSGs can therefore coagulate onto the BG skeleton producing an aggregate containing both BGs and VSGs.
Number density of the grains (in bold) and coagulation time-scale for two grains in a molecular cloud of density nH = 4 × 103 cm-3 with a relative velocity of 0.1 km s-1 (Draine 2004).
5. Conclusion
Far-infrared and sub-mm observations have shown that the grain properties evolve in the transition from the diffuse to the dense ISM (n > 103 Hcm-3). The VSG abundance decreases by 80–100%, the equilibrium temperature of BGs decreases by about 5 K while their sub-mm opacity increases by 2−4. Grain-grain coagulation into fluffy aggregates appears to be an effective process to explain these variations.
In order to understand the nature and the effects of the coagulation process, we have developed a simple model with only two kinds of grain (VSGs and BGs) with a fixed size ratio of 1:17. This simplification is obviously not physical, since the interstellar grain size distribution is extended. However, it allows a precise computation of the optical properties of aggregates with DDA, taking into account their topology. Using this model we have computed the emission and opacity properties of coagulated grains consisting of a small number of BGs.
We show that the coagulation of VSGs and BGs into “fluffy” mixed aggregates can reproduce an enhanced dust opacity at long wavelengths, a reduced dust temperature and a reduced 60 μm emission. The coagulation process appears to be compatible with the dynamical and cloud evolutionary time-scales. An increase in the dust opacity at λ = 250 μm of about 2.6 can be reached for aggregates of 3 BGs of astronomical silicate and 1 BGs of amorphous carbon and with a total 4000 VSGs of amorphous carbon (40% of the volume of the BGs), keeping the ISRF constant. However, this increase is reached when considering “optimal” conditions for the coagulation process: an aggregate of 4 BGs which is relatively elongated, spherical BGs, optimal contact areas between BGs and the number of VSGs which gives the largest increase. With these “optimal” conditions the observed increase of 2 − 4 could be explained. Observations of the Taurus molecular complex with Planck indicate an increase in τ250/NH of around 2 at λ = 250 μm in the denser regions compared to the diffuse ISM (Planck Collaboration 2011a), but radiative transfer effects were not taken into account. The study by Ysard et al. (2012) shows that this increase in τ250/NH of around 2 is likely to increase when considering radiative transfer effects. Since our assumptions for the aggregates are already optimised to get a large increase in the opacity, it would seem unlikely that we could find an increase in opacity larger than 3 by considering only the coagulation of BGs and the VSGs into larger aggregates.
The opacity is sometimes referred to as the emissivity.
Available at http://www.ias.u-psud.fr/DUSTEM/
This assumption is made for computational reasons. We will show in the following that this assumption does not influence the conclusions of this paper.
Acknowledgments
We would like to thank the referee for the helpful comments. We also thank our “Cold Dust” colleagues for fruitful discussions. This research acknowledges the support of the French Agence National de la Recherche (ANR) through the program “Cold Dust” (ANR-07-BLAN-0364-01).
References
- Abergel, A., Boulanger, F., Mizuno, A., & Fukui, Y. 1994, ApJ, 423, L59 [NASA ADS] [CrossRef] [Google Scholar]
- Abergel, A., Boulanger, F., Delouis, J. M., Dudziak, G., & Steindling, S. 1996, A&A, 309, 245 [NASA ADS] [Google Scholar]
- Bazell, D., & Dwek, E. 1990, ApJ, 360, 142 [NASA ADS] [CrossRef] [Google Scholar]
- Bernard, J. P., Abergel, A., Ristorcelli, I., et al. 1999, A&A, 347, 640 [NASA ADS] [Google Scholar]
- Bianchi, S., Gonçalves, J., Albrecht, M., et al. 2003, A&A, 399, L43 [NASA ADS] [CrossRef] [EDP Sciences] [Google Scholar]
- Bot, C., Helou, G., Boulanger, F., et al. 2009, ApJ, 695, 469 [NASA ADS] [CrossRef] [Google Scholar]
- Boulanger, F., Abergel, A., Bernard, J., et al. 1996, A&A, 312, 256 [NASA ADS] [Google Scholar]
- Cambrésy, L., Boulanger, F., Lagache, G., & Stepnik, B. 2001, A&A, 375, 999 [NASA ADS] [CrossRef] [EDP Sciences] [Google Scholar]
- Compiègne, M., Verstraete, L., Jones, A., et al. 2011, A&A, 525, A103 [NASA ADS] [CrossRef] [EDP Sciences] [Google Scholar]
- Coupeaud, A., Demyk, K., Meny, C., Nayral, C., & Leroux, H. 2011, A&A, 535, A124 [NASA ADS] [CrossRef] [EDP Sciences] [Google Scholar]
- del Burgo, C., & Laureijs, R. J. 2005, MNRAS, 360, 901 [NASA ADS] [CrossRef] [Google Scholar]
- del Burgo, C., Laureijs, R. J., Ábrahám, P., & Kiss, C. 2003, MNRAS, 346, 403 [NASA ADS] [CrossRef] [Google Scholar]
- Désert, F., Boulanger, F., & Puget, J. L. 1990, A&A, 237, 215 [NASA ADS] [Google Scholar]
- Draine, B. T. 1985, in Protostars and Planets II, eds. D. C. Black, & M. S. Matthews, 621 [Google Scholar]
- Draine, B. 1988, ApJ, 333, 848 [NASA ADS] [CrossRef] [Google Scholar]
- Draine, B. T. 2004, in The Cold Universe, Saas-Fee Advanced Course 32 (Springer-Verlag), Lecture Notes 2002 of the Swiss Society for Astronomy and Astrophysics (SSAA) (Springer), eds. A. W. Blain, F. Combes, B. T. Draine, D. Pfenniger, & Y. Revaz , 213 [Google Scholar]
- Draine, B. T., & Anderson, N. 1985, ApJ, 292, 494 [NASA ADS] [CrossRef] [Google Scholar]
- Draine, B. T., & Flatau, P. J. 2010, User Guide for the Discrete Dipole Approximation Code DDSCAT 7.1 [arXiv:1002.1505] [Google Scholar]
- Draine, B. T., & Goodman, J. 1993, ApJ, 405, 685 [NASA ADS] [CrossRef] [Google Scholar]
- Draine, B. T., & Lee, H. M. 1984, ApJ, 285, 89 [Google Scholar]
- Draine, B. T., & Li, A. 2001, ApJ, 551, 807 [NASA ADS] [CrossRef] [Google Scholar]
- Dwek, E. 1997, ApJ, 484, 779 [NASA ADS] [CrossRef] [Google Scholar]
- Dwek, E., Arendt, R. G., Fixsen, D. J., et al. 1997, ApJ, 475, 565 [NASA ADS] [CrossRef] [Google Scholar]
- Fogel, M. E., & Leung, C. M. 1998, ApJ, 501, 175 [NASA ADS] [CrossRef] [Google Scholar]
- Henning, T., Michel, B., & Stognienko, R. 1995, PLANSS, 43, 1333 [Google Scholar]
- Hotzel, S., Harju, J., Lemke, D., Mattila, K., & Walmsley, C. M. 2001, A&A, 372, 302 [NASA ADS] [CrossRef] [EDP Sciences] [Google Scholar]
- Jones, A. P. 1988, MNRAS, 234, 209 [NASA ADS] [Google Scholar]
- Jones, A. P. 2011, A&A, 528, A98 [NASA ADS] [CrossRef] [EDP Sciences] [Google Scholar]
- Jones, A. P. 2012a, A&A, 540, A1 [NASA ADS] [CrossRef] [EDP Sciences] [Google Scholar]
- Jones, A. P. 2012b, A&A, 540, A2 [NASA ADS] [CrossRef] [EDP Sciences] [Google Scholar]
- Kemper, F., Vriend, W. J., & Tielens, A. G. G. M. 2004, ApJ, 609, 826 [NASA ADS] [CrossRef] [Google Scholar]
- Kim, S., & Martin, P. G. 1995, ApJ, 444, 293 [NASA ADS] [CrossRef] [Google Scholar]
- Kim, S., Martin, P. G., & Hendry, P. D. 1994, ApJ, 422, 164 [NASA ADS] [CrossRef] [Google Scholar]
- Kiss, C., Ábrahám, P., Laureijs, R. J., Moór, A., & Birkmann, S. M. 2006, MNRAS, 373, 1213 [NASA ADS] [CrossRef] [Google Scholar]
- Köhler, M., Guillet, V., & Jones, A. 2011, A&A, 528, A96 [NASA ADS] [CrossRef] [EDP Sciences] [Google Scholar]
- Kramer, C., Richer, J., Mookerjea, B., Alves, J., & Lada, C. 2003, A&A, 399, 1073 [NASA ADS] [CrossRef] [EDP Sciences] [Google Scholar]
- Lagache, G., Abergel, A., Boulanger, F., & Puget, J. 1998, A&A, 333, 709 [NASA ADS] [Google Scholar]
- Laureijs, R. J., Clark, F. O., & Prusti, T. 1991, ApJ, 372, 185 [NASA ADS] [CrossRef] [Google Scholar]
- Lehtinen, K., Juvela, M., Mattila, K., Lemke, D., & Russeil, D. 2007, A&A, 466, 969 [NASA ADS] [CrossRef] [EDP Sciences] [Google Scholar]
- Li, A., & Draine, B. T. 2001, ApJ, 554, 778 [Google Scholar]
- Li, A., & Greenberg, J. M. 1997, A&A, 323, 566 [NASA ADS] [Google Scholar]
- Mackowski, D. W. 2006, JQSRT, 100, 237 [NASA ADS] [CrossRef] [Google Scholar]
- Mathis, J. S. 1990, ARA&A, 28, 37 [NASA ADS] [CrossRef] [Google Scholar]
- Mathis, J. S. 1992, Science, 258, 1384 [NASA ADS] [CrossRef] [Google Scholar]
- Mathis, J. S., Rumpl, W., & Nordsieck, K. H. 1977, ApJ, 217, 425 [NASA ADS] [CrossRef] [Google Scholar]
- Mathis, J. S., Mezger, P. G., & Panagia, N. 1983, A&A, 128, 212 [NASA ADS] [Google Scholar]
- Meny, C., Gromov, V., Boudet, N., et al. 2007, A&A, 468, 171 [Google Scholar]
- Mie, G. 1908, Ann. Phys., 330, 377 [Google Scholar]
- Ormel, C. W., Paszun, D., Dominik, C., & Tielens, A. G. G. M. 2009, A&A, 502, 845 [NASA ADS] [CrossRef] [EDP Sciences] [Google Scholar]
- Ormel, C. W., Min, M., Tielens, A. G. G. M., Dominik, C., & Paszun, D. 2011, A&A, 532, A43 [NASA ADS] [CrossRef] [EDP Sciences] [Google Scholar]
- Ossenkopf, V. 1993, A&A, 280, 617 [NASA ADS] [Google Scholar]
- Ossenkopf, V., & Henning, T. 1994, A&A, 291, 943 [NASA ADS] [Google Scholar]
- Paradis, D., Bernard, J., & Mény, C. 2009, A&A, 506, 745 [NASA ADS] [CrossRef] [EDP Sciences] [Google Scholar]
- Planck Collaboration 2011a, A&A, 536, A25 [NASA ADS] [CrossRef] [EDP Sciences] [Google Scholar]
- Planck Collaboration 2011b, A&A, 536, A24 [Google Scholar]
- Purcell, E. M., & Pennypacker, C. R. 1973, ApJ, 186, 705 [NASA ADS] [CrossRef] [Google Scholar]
- Ridderstad, M., Juvela, M., Lehtinen, K., Lemke, D., & Liljeström, T. 2006, A&A, 451, 961 [NASA ADS] [CrossRef] [EDP Sciences] [Google Scholar]
- Rouleau, F., & Martin, P. 1991, ApJ, 377, 526 [NASA ADS] [CrossRef] [Google Scholar]
- Sellgren, K. 1984, ApJ, 277, 623 [NASA ADS] [CrossRef] [Google Scholar]
- Stepnik, B., Abergel, A., Bernard, J., et al. 2003, A&A, 398, 551 [NASA ADS] [CrossRef] [EDP Sciences] [Google Scholar]
- Stognienko, R., Henning, T., & Ossenkopf, V. 1995, A&A, 296, 797 [NASA ADS] [Google Scholar]
- Walmsley, M. 1991, in Fragmentation of Molecular Clouds and Star Formation, eds. E. Falgarone, F. Boulanger, & G. Duvert, IAU Symp., 147, 161 [Google Scholar]
- Whittet, D. C. B., Schutte, W. A., Tielens, A. G. G. M., et al. 1996, A&A, 315, L357 [NASA ADS] [Google Scholar]
- Wright, E. L. 1987, ApJ, 320, 818 [NASA ADS] [CrossRef] [Google Scholar]
- Ysard, N., Juvela, M., Demyk, K., et al. 2012, A&A, 542, A21 [NASA ADS] [CrossRef] [EDP Sciences] [Google Scholar]
- Yurkin, M. A., Min, M., & Hoekstra, A. G. 2010, Phys. Rev. E, 82, 036703 [NASA ADS] [CrossRef] [Google Scholar]
- Zubko, V., Dwek, E., & Arendt, R. G. 2004, ApJS, 152, 211 [NASA ADS] [CrossRef] [Google Scholar]
All Tables
PAH, VSG, and BG radii, mass, elemental abundance, and composition for our three-grain model.
at λ = 250 μm, the dust temperature and the increase in the dust opacity (indicated as τnorm) at λ = 250 μm assuming the ISRF for the diffuse ISM.
Number density of the grains (in bold) and coagulation time-scale for two grains in a molecular cloud of density nH = 4 × 103 cm-3 with a relative velocity of 0.1 km s-1 (Draine 2004).
All Figures
|
Fig. 1 Spectral energy distribution of the diffuse ISM determined with DustEM (Compiègne et al. 2011) for the dust model described in Table 1. The temperatures of the single grains are shown in Table 2. Observational data from FIRAS (black thin line with errorbars) and DIRBE (blue symbols); “car” indicates amorphous carbon and “sil” indicates astronomical silicate. |
| In the text | |
|
Fig. 2 Aggregate with 4 BGs and 4000 VSGs in total (40% of the volume of the BGs). The shape is one of the aggregates considered in the model calculations. Each cube represents one dipole. Red cubes indicate VSGs and green cubes BG dipoles. |
| In the text | |
|
Fig. 3 λQabs (left) and |
| In the text | |
|
Fig. 4 One BG with 250, 500, 1000, 1500 and 2000 VSGs (from left to right). Each cube represents one dipole, green cubes indicate the BG dipoles and red cubes the VSG dipoles. |
| In the text | |
|
Fig. 5
|
| In the text | |
|
Fig. 6 λCabs/V (left) and |
| In the text | |
|
Fig. 7 Spectral energy distribution (SED) calculated with DustEM for coagulated grains (solid lines): a) 1 BG plus 1000 VSGs, b) 4 BGs plus in total 4000 VSGs (two components) and c) 4 BGs plus in total 4000 VSGs (one component). The dashed lines indicated the calculated SED of the diffuse ISM determined with DustEM for single grains as in Fig. 1 before coagulation (dashed lines). The symbols indicate the observations of the diffuse ISM as shown in Fig. 1; “car” indicates amorphous carbon and “sil” indicates astronomical silicate, “mixed” indicates aggregates with 4 BGs, where 1 BG is of amorphous carbon and 3 BGs of astronomical silicate, and of 16 BGs, where 4 BGs are of amorphous carbon and 12 BGs of astronomical silicate. |
| In the text | |
|
Fig. 8 The variations in temperature (left) and intensity at 250 μm (right) due to changes in the ISRF, G0, are shown for different grains. |
| In the text | |
Current usage metrics show cumulative count of Article Views (full-text article views including HTML views, PDF and ePub downloads, according to the available data) and Abstracts Views on Vision4Press platform.
Data correspond to usage on the plateform after 2015. The current usage metrics is available 48-96 hours after online publication and is updated daily on week days.
Initial download of the metrics may take a while.