Free Access
Fig. 2
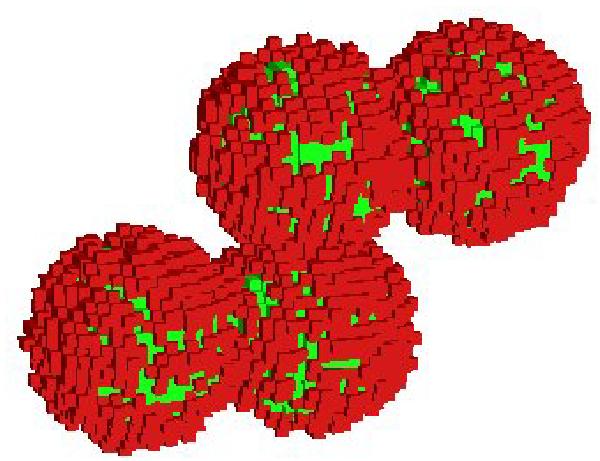
Aggregate with 4 BGs and 4000 VSGs in total (40% of the volume of the BGs). The shape is one of the aggregates considered in the model calculations. Each cube represents one dipole. Red cubes indicate VSGs and green cubes BG dipoles.
Current usage metrics show cumulative count of Article Views (full-text article views including HTML views, PDF and ePub downloads, according to the available data) and Abstracts Views on Vision4Press platform.
Data correspond to usage on the plateform after 2015. The current usage metrics is available 48-96 hours after online publication and is updated daily on week days.
Initial download of the metrics may take a while.