Fig. A.1
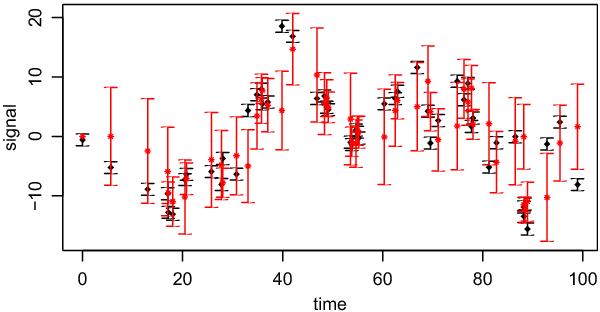
Example simulated OU process. The black points (with a uniform random time distribution) have been simulated from an OU process with parameters τ = 10, c = 20 and initial conditions t1 = 0, z1 = 0, to which Gaussian measurement noise with mean zero and unit standard deviation has been added (as indicated by the black error bars). This red points show the predictions of this process using the OU process time series model with parameters τ = 10, c = 20, μ [z1] = 0, V [z1] = 0. The prediction for each event is a Gaussian in the signal with mean and variance given Eq. (A.10).
Current usage metrics show cumulative count of Article Views (full-text article views including HTML views, PDF and ePub downloads, according to the available data) and Abstracts Views on Vision4Press platform.
Data correspond to usage on the plateform after 2015. The current usage metrics is available 48-96 hours after online publication and is updated daily on week days.
Initial download of the metrics may take a while.