Fig. 2
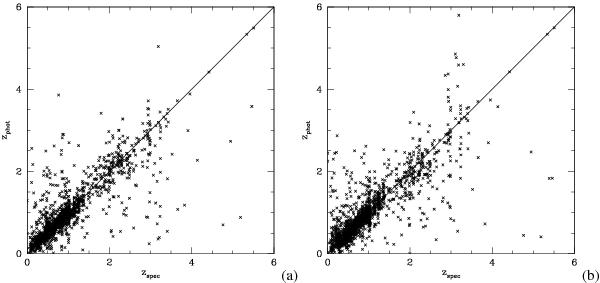
Results obtained by our model and provided by the PHAT contest board in terms of direct comparison between our photometric and blind spectroscopic information. The a) panel plots the photometric vs. spectroscopic redshifts for the whole dataset using 10 photometric bands (Experiment 37). In panel b) the same but using only 14 photometric bands (Experiment 26). (Courtesy of H. Hildebrandt).
Current usage metrics show cumulative count of Article Views (full-text article views including HTML views, PDF and ePub downloads, according to the available data) and Abstracts Views on Vision4Press platform.
Data correspond to usage on the plateform after 2015. The current usage metrics is available 48-96 hours after online publication and is updated daily on week days.
Initial download of the metrics may take a while.