| Issue |
A&A
Volume 545, September 2012
|
|
|---|---|---|
| Article Number | A115 | |
| Number of page(s) | 9 | |
| Section | Astrophysical processes | |
| DOI | https://doi.org/10.1051/0004-6361/201219618 | |
| Published online | 18 September 2012 | |
The viscosity parameter α and the properties of accretion disc outbursts in close binaries
1
Astronomical Observatory, Jagellonian University,
ul. Orla 171,
30-244
Kraków,
Poland
e-mail: This email address is being protected from spambots. You need JavaScript enabled to view it.
2
Institut d’Astrophysique de Paris, UMR 7095 CNRS, UPMC Université
Paris 6, 98bis Bd
Arago, 75014
Paris,
France
Received:
16
May
2012
Accepted:
6
August
2012
Abstract
Context. The physical mechanisms driving angular momentum transport in accretion discs are still unknown. Although it is generally accepted that, in hot discs, the turbulence triggered by the magneto-rotational instability is at the origin of the accretion process in Keplerian discs, it has been found that the values of the stress-to-pressure ratio (the α “viscosity” parameter) deduced from observations of outbursting discs are an order of magnitude higher than those obtained in numerical simulations.
Aims. We test the conclusion about the observation-deduced value of α using a new set of data and comparing the results with model outbursts.
Methods. We analyse a set of observations of dwarf-nova and AM CVn star outbursts and from the measured decay times determine the hot-disc viscosity parameter αh. We determine if and how this method is model dependent. From the dwarf-nova disc instability model we determine an amplitude vs. recurrence-time relation and compare it to the empirical Kukarkin-Parenago relation between the same, but observed, quantities.
Results. We found that all methods we tried, including the one based on the amplitude vs. recurrence-time relation, imply αh ~ 0.1−0.2 and exclude values an order of magnitude lower.
Conclusions. The serious discrepancy between the observed and the MRI-calculated values of the accretion disc viscosity parameter α is therefore real since there can be no doubt about the validity of the values deduced from observations of disc outbursts.
Key words: accretion, accretion disks / stars: dwarf novae / instabilities
© ESO, 2012
1. Introduction
Since the very beginning of the accretion-disc theory, the mechanism of angular momentum transport through the disc has been a matter of debate, and despite strenuous efforts of many researchers it remains an open problem because the results of numerical simulations do not match observations when the respective values of the viscosity parameter α (Shakura & Sunyaev 1973) are compared (King et al. 2007; see, however, Sorathia et al. 2012). Magneto-rotational instability (MRI; Balbus & Hawley 1998) simulations result in average α values of the order of 0.01, whereas the best studied case of dwarf-nova outbursts unambiguously provide values that are an order of magnitude higher (Smak 1999, hereafter S99).
In addition, from simulations of dwarf nova (DN) eruptions it is clear that α must vary during outbursts. The outburst amplitudes can be reproduced only if αc in the quiescent disc is four to ten times smaller than αh in the hot, outbursting state (see e.g. Smak 1984a; Meyer & Meyer-Hofmeister 1984). This holds regardless of the disc chemical composition (however, the required α jump is rather 2–6 for helium-dominated discs, see Kotko et al. 2012). Since observations impose αh ≈ 0.1−0.3, the cold disc αc should be ~0.01. This is inconsistent with the MRI simulations that result in αh ~ 0.01 (see e.g. Hirose et al. 2009) and do not predict α jumps (Sorathia et al. 2012, obtain α jumps but with timescales too short to correspond to the dwarf-nova case). In the present article we revisit the problem of αh determination using a new set of data and methods that are somewhat different from those used by S99. We confirm his general conclusions about the value of αh.
The values of the viscosity parameter α deduced from observations of dwarf-nova decay from outburst maximum are almost model-independent. Basically one only assumes that the decay time reflects the viscous character of this process.
On the other hand, the phenomenological relation between the outburst amplitude and the recurrence time (the so-called Kukarkin-Parenago (K-P) relation; Kukarkin & Parenago 1934; Warner 2003) obviously reflects some properties of the outbursts and should be derivable from the model supposed to be describing dwarf-nova outbursts, i.e. from the disc instability model (DIM; see Lasota 2001, for a review). Using the DIM we derive an amplitude – recurrence-time relation that compares reasonably well with the K-P relation, especially considering the large scatter of the observational data. We find that this K-P type relation also implies that αh cannot be of the order of 0.01 but must be roughly ten times larger than this value.
In Sect. 2 we briefly describe those aspects of the DIM that are required for understanding dwarf nova outbursts and the quantities that characterize them. The estimate of αh from the empirical relation and from the analytical derivation of the outburst decay time are presented in Sect. 3. Section 4 deals with the details of the analytical derivation of the Kukarkin-Parenago relation and its consequences for the parameter αh. Conclusions are presented in Sect. 5.
2. The dwarf nova outburst cycle in the DIM description
Outbursts of DN can be divided into two types: normal outbursts and superoutbursts. As “normal” one defines outbursts that are narrow, i.e. lasting no longer than about ten days, and that have amplitudes lower than ~6 mag and during which no superhumps (low-amplitude brightness variations) have been observed. Superhumps are the identification mark of the superoutbursts, which are also brighter and last longer than normal outbursts. In what follows “outbursts” only refers to normal DN outbursts. DN showing only normal outbursts are classified as U Gem-type, whereas binaries exhibiting both normal and super outbursts belong to the SU UMa type.
In many DN of U Gem-type (e.g. in SS Cyg and U Gem), a bimodality in the normal outbursts widths has been observed. The “wide” outbursts are ~0.2 mag brighter and evidently longer than the “narrow” outbursts. It has not been defined how much longer the outburst should be to be recognized as “wide”, but the difference is clear when looking at a specific light-curve. The wide outbursts should not be confused with superoutbursts, the former being normal DN outbursts with no superhumps detected, which in turn are the characteristic feature of the latter. According to the DIM, wide outbursts correspond to outside-in heating front propagation, while narrow outbursts result from the opposite sense of motion of these fronts (Smak 1984a).
During quiescence a dwarf nova disc accumulates matter until somewhere the temperature crosses the value critical to the onset of the thermal instability. A heating front starts propagating into the low-temperature regions, leaving behind ionized matter. If the radius where it started is close to the inner disc edge the front will propagate in the outward direction and the outburst will be of the inside-out type. If the front travels inwards from the outer edge, the outburst is an outside-in outburst.
In the post-front hot regions of the disc the angular momentum transport is defined by αh and the accretion rate Ṁaccr rises. The enhanced efficiency of the outward angular momentum transport in the hot disc (αh > αc) causes mass, which during the quiescence had gathered in the outer parts of the disc, to diffuse inwards at a high rate changing the surface-density Σ profile from Σ ~ R to Σ ~ R−3/4. Once the heating front arrives at the outer (inner) disc edge, matter across the whole disc becomes ionized, and Ṁaccr everywhere in the disc becomes roughly constant and higher than the mass-transfer rate from the secondary (see Fig. 4). In this phase the outburst is at its maximum, the disc is hot and the Shakura & Sunyaev (1973) solution is a good approximation of such a quasi-stationary configuration.
Because of ongoing accretion onto the central body the accretion rate (and density)
decrease at a characteristic viscous timescale. Because the hot-disc critical surface
density  (see Appendix A), Σ on the outer edge easily falls below its critical
value and a cooling front starts propagating inwards (see Fig. 3). The decay from outburst maximum can be seen as due to viscous emptying of a
hot disc with a shrinking outer radius.
(see Appendix A), Σ on the outer edge easily falls below its critical
value and a cooling front starts propagating inwards (see Fig. 3). The decay from outburst maximum can be seen as due to viscous emptying of a
hot disc with a shrinking outer radius.
Once the disc has lost matter accumulated during quiescence the refilling process restarts. Strictly speaking the disc is filling up already during the outburst what allows the existence of outburst cycles with practically no quiescence.
3. The value of the viscosity α parameter in the hot accretion discs
As mentioned above the decay timescale is determined by the viscous timescale tvisc in the hot disc. Since tvisc ~ R2/ν, assuming that the kinematical viscosity coefficient ν ~ αcsH, where cs is the sound speed and H the disc semi-thickness, determining the decay time allows estimation of α, assuming one can estimate the disc radius (e.g. from the binary’s orbital period).
S99 obtained an observational relation between the outburst decay rate τdec(or alternatively the outburst width W) and the orbital period Porb: tdec(Porb) and W(Porb). After comparing it with the relations of the same type found from the fits to data from the numerical models, he concluded that the best agreement between observation and models is obtained for αh = 0.2. Below, we determine the viscosity parameter using a different DN sample and different numerical models.
3.1. α from the decay rate vs. the disc radius relation
To be certain that the result is independent of the choice of the DN sample for deriving the τdec − Porb relation, we used a set of observational data different from S99, who used the data from van Paradijs (1983) and Warner (2003) that include all types of DN: the U Gem, SU UMa, Z Cam stars, while our sample contains systems from Ak et al. (2002), together with an additional seven U Gem-type DN for which we measured the decay rates using light-curves from the AFOEV database. Among the twenty one systems that we took into account nine have been included also in S99.
Since it has been shown that the basic DIM (with no mass transfer rate enhancement or the additional sources of disc heating) is only able to reproduce normal outbursts (see Lasota 2001; Kotko et al. 2012, and references therein), we find it reasonable to start our analysis with U Gem-type systems where only normal outbursts are present1 to ensure that the comparison between τdec measured in the models and in the real light-curves is consistently defined. Then, to test to what extent other DN types and the disc chemical composition influence the correlation between τdec and Porb, normal outbursts of SU UMa stars and one AM CVn system (PTF1J0719) have been added to the sample.
The systems considered are listed in Table 1 and marked in Fig. 1. The decay rates of U Gem-type binaries (rows 1−8) and the decay rates for the normal outbursts in SU UMa-type binaries (rows 14−20) are taken from Ak et al. (2002). In rows 9−13 are 7 U Gem-type binaries not included in Ak et al. (2002). For each of them we have measured τdec as the time it takes the system brightness to decline by ~1 mag starting from the level 1 mag below the maximum. The last row stands for the only AM CVn-type star for which the existence of the normal outburst have been confirmed (Levitan et al. 2011).
Decay-from-outburst properties of selected dwarf novae.
First, we compared our fit to the
τdec–Porb relation with the one
obtained by S99. The linear fit to our data of the form
τdec = CτPorb
(the “Bailey relation”; Bailey 1975) gives
Cτ = 0.37 ± 0.03 with dispersion
rms = 0.698 which compares nicely with the result of S99:
Cτ,S99 = 0.38 ± 0.02 with rms = 0.54. For
the more general case when  we get
 and
β = 0.66 ± 0.14 with dispersion rms = 0.64, while S99 result is
and
β = 0.66 ± 0.14 with dispersion rms = 0.64, while S99 result is
 and
βS99 = 0.71 ± 0.09 with dispersion rms = 0.48. Our results
are similar to those of S99 within the uncertainty of the fit coefficients.
and
βS99 = 0.71 ± 0.09 with dispersion rms = 0.48. Our results
are similar to those of S99 within the uncertainty of the fit coefficients.
Next, we compared model decay times with those observed during dwarf-nova outbursts. Because models are calculated not for a given Porb but for a given disc radius, we convert orbital periods of observed systems into the disc radii.
During outburst the outer disc radii in DN expand up to
Rd,max ~ 0.9RL1
(see e.g. Smak 2001), where
RL1 is the radius of a primary Roche-lobe given
by the Eggleton (1983) formula: 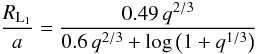 (1)
(1) (2)where
q = M1/M2
and Phr is the orbital period in hours.
(2)where
q = M1/M2
and Phr is the orbital period in hours.
The primary and the secondary masses (M1 and M2) for calculations of Rd,max from Porb were taken from the latest version (November 2011) of Ritter & Kolb (2003). For PTF1J0719, M1 and M2 have been guessed according to what is expected for AM CVn stars since no observational estimates have been suggested yet. The fit in the form τdec = A1Rd,max to all data from Table 1 gives A1 = 0.48 ± 0.02 with dispersion rms = 0.56.
It is interesting to check whether the τdec − Rd,max relation is independent of the class of systems exhibiting normal outbursts. The τdec–Rd,max relation for U Gem-type binaries is linear to a good approximation. For the linear fit one obtains A1 = 0.49 ± 0.03 with dispersion rms = 0.68. The coefficients for the general relation τdec = B1Rd,maxγ are B1 = 0.27 ± 0.12 and γ = 1.32 ± 0.22 with rms = 0.66. In this case, similar to what was noticed by S99, the rms dispersions do not differ significantly for the linear and non-linear fits, moreover the errors of B1 and γ are rather large. Therefore we limit our further considerations to the simpler linear case.
According to the model, the outbursts appearing between superoutbursts of SU UMa stars have the same origin as those in U Gem-type binaries. As expected, their measured τdec marked on the τdec–Rd,max plane extrapolate the τdec–Rd,max relation for U Gem to the regime of orbital periods shorter than 2 h. The coefficient A1 of the linear fit for the sample, including the normal outbursts of U Gem-type and SU UMa-type DN is A1 = 0.48 ± 0.03 with dispersion rms = 0.57.
As discussed in Kotko et al. (2012), PTF1J0719 is the only system in the AM CVn class of binaries where short outbursts can be firmly classified as “normal” and the system considered as a helium counterpart of an SU UMa-type DN. With PTF1J0719 taken into account, the coefficient of the linear fit remains almost unchanged.
We conclude that the τdec − Rd,max relation is universal for normal outbursts of all classes of cataclysmic variables. To estimate the αh parameter one needs to find the relevant τdec − Rd,max relation for model light-curves calculated with different αh and compare the result with observations. We chose four values of αh: 0.05, 0.1, 0.2, and 0.3, for each of them the set of models with different mass transfer rates Ṁtr, primary masses M1 and maximum disc radii Rd,max were calculated. The decay rates of the synthetic outbursts were measured in the same manner as in the observational case.
To obtain the synthetic light-curves we used the code described in Hameury et al. (1998), which differs from the code used by S99; for example the input parameters are different2, and in our code the adaptive grid enables high resolution of the fronts. Such differences should not affect modelling of the decay phase of the outburst.
When measuring τdec of the outbursts for a wide range of model parameters, one has to pay attention to several problems:
-
(a)
For large discs (Rd,max > 5.0 × 1010 cm) and high primary masses (M1 > 1 M⊙), so-called “reflares” appear during the decline from maximum. They are an indication of the cooling and heating front reflections in the disc, where the surface density is close to its critical value (for details see e.g. Menou et al. 2000; Dubus et al. 2001). In this case the model outburst cannot be considered as normal.
-
(b)
In large discs and for high values of αh , inside-out heating fronts may not be able to propagate up to the outer disc edge because such values of the viscosity parameter decrease the value of
 (see
the formulae in Appendix A) and, with
increasing R, increase the possibility of a cooling front forming
right behind the heating front. In this case the cooling front will start at
R ≪ Rd,max and the
decay rate will not be connected with the actual radial extent of the disc.
(see
the formulae in Appendix A) and, with
increasing R, increase the possibility of a cooling front forming
right behind the heating front. In this case the cooling front will start at
R ≪ Rd,max and the
decay rate will not be connected with the actual radial extent of the disc. -
(c)
Models with the same parameters except for αh have different stability limits.
The above-mentioned DIM properties have their reflection in the distribution of the model points in Fig. 1. For large Rd,max models with higher αh tend to deviate more from the empirical taud-Rd,max relation.
Linear fits to the τdec = AαRd,max relation obtained for the models with different αh give
-
1.
A0.05 = 1.624 ± 0.235 for αh = 0.05;
-
2.
A0.1 = 0.525 ± 0.128 for αh = 0.1;
-
3.
A0.2 = 0.338 ± 0.036 for αh = 0.2;
-
4.
A0.3 = 0.151 ± 0.031 for αh = 0.3.
The coefficients Aα show a clear tendency to decrease when a higher αh is set in the model. The comparison with A1 obtained from the fits to empirical data shows that αh ∈ [0.1,0.2] , with no unambiguous preference for one of these values, thus confirming conclusions obtained by S99.
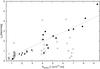 |
Fig. 1 The τdec–Rd,max relation. Filled symbols: U Gem-type systems (circles), normal outbursts of SU UMa-type systems (diamonds), and PTF1J0719 (square). Open symbols: models with αh = 0.1 (circles), αh = 0.2 (squares), αh = 0.3 (triangles). The dotted line - linear fit to the observational data (filled symbols) in the form τdec = A1Rd,max, with A1 = 0.48. (For the sake of clarity models with αh = 0.05 were not plotted.) |
SU UMa-type stars and their superoutbursts provide another piece of interesting information. The decay from superoutburst may be divided into at least two phases – the plateau and fast decay phases. According to the enhanced mass-transfer (EMT) model (Kotko et al. 2012; Smak 2008, 2009a,b,c,d), during the plateau phase the slow decline of the system luminosity is caused by accretion-driven depletion of the excess matter provided by the enhanced mass transfer from the secondary. This phase ends when a cooling front forms, and so the following fast decline is caused by the mechanism producing normal outbursts.
Based on this, we measured τdec during the fast decay phase
of SU UMa superoutbursts and found that they are approximately the same as the
τdec measured for their normal outbursts. The same is true
of superoutbursts and normal outbursts in the models calculated with the prescription for
the  enhancement given in Hameury et al. (1997). The
decay time in the fast decline phase was measured as the time interval between the time
the system luminosity was 1 mag below the start of the decline phase to the time when the
system was 2 mag below it.
enhancement given in Hameury et al. (1997). The
decay time in the fast decline phase was measured as the time interval between the time
the system luminosity was 1 mag below the start of the decline phase to the time when the
system was 2 mag below it.
This conclusion is very promising in the context of evaluating αh in AM CVn stars. As already mentioned, the normal outbursts in AM CVn stars are rarely detected, and the outburst cycle is dominated by superoutbursts. However, with well observed, fast decay phases of the superoutbursts in AM CVn stars, it will be possible to estimate αh in helium-dominated discs more precisely. Unfortunately the currently available data are not of sufficient quality to permit such investigations.
3.2. The outburst width – orbital period relation
van Paradijs (1983) showed that there exists a positive correlation between the outburst width W and the orbital period but concluded that narrow and wide outbursts should be considered separately.
To consistently determine the outburst width in various systems, the magnitude level at which it is measured has to be defined. Following van Paradijs (1983) S99 defines W as the time interval during which the system luminosity is above the level set at 2 mag below the outburst maximum.
Using data from van Paradijs (1983), S99 finds the coefficients for
-
the linear dependence in the form W = CW,S99Porb: CW,S99 = 1.39 ± 0.06;
-
the non-linear dependence in the form W = CW,S99PorbβS99:
 and
βS99 = 0.78 ± 0.11.
and
βS99 = 0.78 ± 0.11.
Since, as in S99, we find the linear fit to be of superior quality, in what follows we do not use the non-linear fitting formula. We also only use narrow outbursts as “generic” normal outbursts. The linear fit to our data (18 systems) gives CW = 0.99 ± 0.12, so the agreement with S99 is not as good as for the decay times.
The analogous procedure applied to different subsets of our data gives
-
for U Gem stars from Aket al. (2002) only:CW = 0.79 ± 0.07;
-
for U Gem stars from Ak et al. (2002) complemented with our measurements: CW = 0.90 ± 0.10.
The measurements of the outbursts width are clearly more vulnerable to uncertainties that are connected with the precise determination of the outburst maximum and with usually sparser data coverage of the outburst rise in comparison to the outburst decline. Moreover, except for systems observed intensively for a long time (such as the already mentioned SS Cyg or U Gem), straightforward assessment of which outbursts are narrow and which are wide may be problematic. Nevertheless, it is worth comparing observations with models as has been done in Sect. 3.1 for τdec. The width W of synthetic outbursts has been defined in the same manner as in the observational case.
When applying the linear dependence W = CαRd,max to the same set of models as in Sect. 3.1, one obtains
-
1.
C0.05 = 3.222 ± 1.132 for αh = 0.05;
-
2.
C0.1 = 1.794 ± 0.285 for αh = 0.1;
-
3.
C0.2 = 1.502 ± 0.112 for αh = 0.2;
-
4.
C0.3 = 0.872 ± 0.165 for αh = 0.3.
Comparison of the above listed Cα’s with C1 = 1.496 ± 0.135 determined from the observed relation W = C1Rd,max again favours αh ∈ [0.1,0.2] with even stronger indication of αh = 0.2.
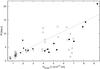 |
Fig. 2 The W-Rd,max relation. Filled symbols: U Gem-type systems (circles), normal outbursts of SU UMa-type systems (diamonds), and PTF1J0719 (square). Open symbols: models with αh = 0.1 (circles), αh = 0.2 (squares), αh = 0.3 (triangles). The dotted line – linear fit to the observational data (filled symbols) with a coefficient C1 = 1.496. (For the sake of clarity models with αh = 0.05 were not plotted.) |
Decay rates for several solar composition disc models.
The model and observational data with fitted linear dependence between W and Rd,max are presented in Fig. 2. Even if W is not determined well enough to provide a firm value of αh from the W − Rd,max relation, the results obtained totally preclude αh ≪ 0.1.
3.3. The decay time from the DIM
Since we have assumed that the decay from outburst’s maximum is described by the standard
DIM, it is worth checking how strongly model-dependent the results are concerning the
value of the viscosity parameter. In principle, the setting is very simple: shrinking
(from outside) hot-disc configurations decay through a set a quasi-stationary solutions
corresponding to monotonically diminishing accretion rates. This prompted S99 to estimate
the decay time as: 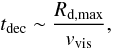 (3)where the viscous speed
vvis ~ ν/R.
However, S99 used a non-standard definition of the kinematic viscosity coefficient. To
clarify this point we recall that the idea behind the Shakura & Sunyaev (1973)α ansatz is that the component
τrφ of the stress-tensor should be
proportional to the total pressure P with the proportionality constant
α describing the efficiency of the angular momentum transport due to
turbulence in the disc:
τrφ = −αP, where
0 < α < 1. On the other
hand, in a differentially rotating fluid the tangential stress is defined as
τrφ = ηdΩ/dR,
where η is the dynamical viscosity coefficient, R the
radius, and Ω the angular speed. For a Keplerian disc, therefore, the kinematic viscosity
coefficient ν = η/ρ,
where ρ is the density, can be written as
(3)where the viscous speed
vvis ~ ν/R.
However, S99 used a non-standard definition of the kinematic viscosity coefficient. To
clarify this point we recall that the idea behind the Shakura & Sunyaev (1973)α ansatz is that the component
τrφ of the stress-tensor should be
proportional to the total pressure P with the proportionality constant
α describing the efficiency of the angular momentum transport due to
turbulence in the disc:
τrφ = −αP, where
0 < α < 1. On the other
hand, in a differentially rotating fluid the tangential stress is defined as
τrφ = ηdΩ/dR,
where η is the dynamical viscosity coefficient, R the
radius, and Ω the angular speed. For a Keplerian disc, therefore, the kinematic viscosity
coefficient ν = η/ρ,
where ρ is the density, can be written as 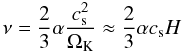 (4)where
cs is the sound speed, ΩK the Keplerian angular
speed, and
H ≈ cs/ΩK the
disc (semi) height-scale and not the disc’s actual (e.g. photospheric) height
z0 as assumed in S99.
(4)where
cs is the sound speed, ΩK the Keplerian angular
speed, and
H ≈ cs/ΩK the
disc (semi) height-scale and not the disc’s actual (e.g. photospheric) height
z0 as assumed in S99.
Fortunately, αh was not calculated in S99 directly from the analytical formula but obtained (as we did in the previous sections) from comparing the theoretical and empirical dependence between the outburst decay rate (or the outburst width) and the orbital period, so this article’s conclusions concerning the value of the viscosity parameter in hot accretion discs remain valid. Nevertheless, it would be useful to derive an analytical formula for τdec, which would only depend on αh and observables since it would allow dispensing with using numerically calculated models, especially because these must be selected according to criteria discussed in Sect. 3.1. In Table 2 we compared decay rates calculated from numerical models (τdecm) with the values (τdecv) corresponding to Eq. (3). (In the selected models fronts always propagate through the whole disc extent.) Clearly the rates obtained from Eq. (3) are much too long and the approximation used was too crude.
Indeed, the decrease in luminosity after the outburst maximum is the effect of two mechanisms: (1) the depletion of the matter from the disc due to (viscous) accretion onto the central object; and (2) the propagation of the cooling front through the disc (also a viscous process, for details see Menou et al. 1999; Lasota 2001). Taking the disc shrinking into account lowers the decay time.
We assume that the decay time tdec is the time it takes the
system luminosity to drop from the maximum to the quiescence level and that it may be
written approximately as 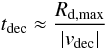 (5)where
(as before) Rd,max is the maximum disc radius
and vdec a decline velocity.
(5)where
(as before) Rd,max is the maximum disc radius
and vdec a decline velocity.
To find a simple formula we assumed that vdec is the
superposition of (a) the inward viscous velocity vvisc of
matter in the hot part of the disc into which the cooling front propagates and (b) the
outward velocity of the gas at the front vF3 (Menou et al. 1999) allowing
the inward propagation of the front; i.e.
| vdec | ≈ | vvisc + vF | .
This crude approximation treating the two velocities as an average over space values gives
quite good results, as seen in Table 2. This is
because for most of the disc’s extent (in the “asymptotic regime”: Menou et al. 1999, their Fig. 7), vF is
roughly constant. Since
vvisc ≈ ν/R,
from Eq. (4) one has  (6)where
 and P is the total pressure.
From numerical simulations, Menou et al. (1999)
find that
vF ~ 1/7αh cs.
We confirmed this result for cooling front velocity in solar composition discs and found
that it also applies to a helium-dominated disc. The final formula for
tdec is thus:  (7)The speed of sound can be
expressed in terms of the central temperature in the disc:
(7)The speed of sound can be
expressed in terms of the central temperature in the disc:
 ,
where k is the Boltzmann constant and mH the
hydrogen molecular mass. (In the case of a helium disc it should be replaced by helium
molecular mass.) The numerical fit to the temperature at the cooling front found from
models of solar-composition discs gives
,
where k is the Boltzmann constant and mH the
hydrogen molecular mass. (In the case of a helium disc it should be replaced by helium
molecular mass.) The numerical fit to the temperature at the cooling front found from
models of solar-composition discs gives  (8)with no dependence
on disc parameters. From Table 2 one can see that
Eq. (7) can give reliable estimates of of
the viscosity parameter, certainly better than Eq. (3).
(8)with no dependence
on disc parameters. From Table 2 one can see that
Eq. (7) can give reliable estimates of of
the viscosity parameter, certainly better than Eq. (3).
For AM CVn stars, e.g. PTF1J0719, the chemical composition
(Y = 0.98 Z = 0.02) gives  (9)From Eqs. (7) and (8) (or (9)) it is clear that
tdec depends on
Rd,max, M1, and
αh. The primary mass M1
determines the white dwarf radius R1 through the
M − R relation (Nauenberg 1972). Both M1 and
Rd,max define the disc’s extent since the
model assumes that the inner disc radius
Rin = R1.
(9)From Eqs. (7) and (8) (or (9)) it is clear that
tdec depends on
Rd,max, M1, and
αh. The primary mass M1
determines the white dwarf radius R1 through the
M − R relation (Nauenberg 1972). Both M1 and
Rd,max define the disc’s extent since the
model assumes that the inner disc radius
Rin = R1.
To compare the observed outbursts decay rates τdeco with the analytical decay rates τdect, the derived tdec has to be divided by the amplitude of the outburst. For each system with measured Porb and estimated M1 and M2 (necessary for calculating Rd,max), there is only one free parameter left: αh. Thus the conformity between the observed decay rate τdeco and τdect calculated from Eq. (7) can be attained by adjusting αh. We assumed αh = 0.2. The calculation results are summarized in Table 1. It is seen that the calculated time is close to the observed one in most cases. In a few cases the discrepancy is large. It is not clear if it is due to the imprecision in measuring the decline time, the peculiar nature of the outbursts, or to the non-universal value of αh. After all, since MRI does not give the correct value of this parameter, we do not really know what physical mechanism drives accretion in hot dwarf nova discs, so there is no reason to assume that it is “generic”.
One should keep in mind, however, that the significant impact on αh has the determination accuracy of the observed outbursts amplitudes. An underestimate of An may be the cause of significantly higher αh for TW Vir, WX Hyi, and PTF1J0719.
4. The Kukarkin-Parenago relation
The first to suggest a relation between the outburst amplitude
An and the outburst recurrence time
Tn were Kukarkin &
Parenago (1934). However, since their sample contained outbursts of both recurrent
and dwarf novae, its reality has been questioned (Payne-Gaposchkin 1957, 1977; Bath & Shaviv 1978). In his seminal review
article, Smak (1984b) attributes the correlation to
Payne-Gaposchkin (1977) and stresses its
statistical character. Finally, analysing dwarf nova normal-outbursts data, van Paradijs (1985) concluded that “the amplitudes and
average recurrence times of dwarf novae are correlated”. The most recent version of the
K-P relation in Warner (2003) takes the form
 (10)where
Tn is in days and An in
magnitudes.
(10)where
Tn is in days and An in
magnitudes.
Although it has been argued that the K-P relation might represent some global and average properties of DN outbursts (van Paradijs 1985), to the best of our knowledge no derivation from the model has been attempted until now.
While the other relations, connecting various quantities characterizing the binary systems and their outburst light-curves (such as the absolute visual magnitude-at-maximum MV,max(Porb) or the τdec(Porb) relations (see Warner 2003, and Sect. 3.3) follow directly from the DIM, derivation of the K-P relation is not straightforward. Of course as the outburst amplitude is related to the mass of the disc and the mass of the disc to the accumulation time, a relation of the K-P form should be expected in principle. For example, van Paradijs (1985) speculated that the average amount of mass ΔMquies transferred during an average recurrence time Tn: ΔMquies = TnṀquies is constant over the dwarf nova population, but also warned about possible selection effects and model dependence. Here, we try to examine what kind An(Tn) relation, if any, can be deduced from the DIM in its simplest (and when possible simplified) form.
For simplicity we assume that, during quiescence, the accumulation rate
Ṁaccum of the mass in the disc is approximately equal to the
mass transfer rate from the secondary Ṁtr (this assumes no
truncation of the inner edge of the disc; no “leaky” disc) and that the mean accretion rate
during outburst is about half the maximum accretion rate during outburst
 .
(This follows from the shape of the function
Ṁaccr(t) in the model, which is rapidly
rising and then approximately exponentially decreasing during the outburst.)
.
(This follows from the shape of the function
Ṁaccr(t) in the model, which is rapidly
rising and then approximately exponentially decreasing during the outburst.)
It is worth remarking here that the maximum accretion rate
 is only approximately equal to
  and simulations clearly show
that the mass accretion reaches the maximum only after the cooling front has started to
propagate (see Fig. 3).
and simulations clearly show
that the mass accretion reaches the maximum only after the cooling front has started to
propagate (see Fig. 3).
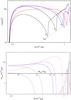 |
Fig. 3 Top: evolution of the Σ profile during the propagation of the
cooling front. Numbers next to the lines stand for the subsequent moments of the front
propagation (1 is near the moment of the inset of the cooling front).
Bottom: evolution of the |

The accretion rate keeps rising when the heating front arrives at the outer disc edge and a
cooling front starts propagating. This is because just before the launch of the cooling
front, the Σ-profile had not yet reached the stationary hot disc Σ shape and the mass from
the heated parts near the outer edge had not have time to diffuse fully inwards. During the
initial phase of the cooling-front propagation, this mass excess keeps diffusing inwards
since it is also “shoved” by the incoming cooling front. The mass accretion rate will
eventually drop due to the appearance of the mass shortage in the inner parts of the disc
caused by two mechanisms: (1) accretion onto the white dwarf and (2) the strong outflow of
mass at the cooling front, which shuffles the mass to the outer parts of the disc (see Sect.
3.3). Guided by the simulation results, we assume
 , with ϵ ~ 3
in the following.
, with ϵ ~ 3
in the following.
The amount of mass accreted during the outburst decay is equal to the mass accumulated in the disc during quiescence and the rise to outburst maximum: ΔMaccr = ΔMaccum,
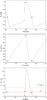 |
Fig. 4 Changes of the disc mass Mdisc (top),
magnitude (middle), and mass accretion rate
|
 (11)where
tquiesc is the duration of the quiescence,
trise the time it takes the outburst to reach its (bolometric)
luminosity maximum, and tdec the duration of the outburst decay
to the quiescence level. Strictly speaking, mass accumulation also occurs during the last
part of the decline from maximum (from points 1 to 2 in Fig. 4) but this has a negligible effect on the total mass balance.
(11)where
tquiesc is the duration of the quiescence,
trise the time it takes the outburst to reach its (bolometric)
luminosity maximum, and tdec the duration of the outburst decay
to the quiescence level. Strictly speaking, mass accumulation also occurs during the last
part of the decline from maximum (from points 1 to 2 in Fig. 4) but this has a negligible effect on the total mass balance.
The decay time tdec is calculated as described in Sect. 3.3.
Six sets of parameters for which the theoretical K-P relation has been calculated.
The outburst recurrence time Tn is counted from the onset of
the outburst to the onset of the following one
(Tn = trise + tdec + tquiesc),
while the accumulation time is
tquiesc + trise.
(trise is non negligible in some type of outbursts, and it is
important to include it to be able to account for e.g. the “cycling state” outbursts where
no quiescence phase is present.) Substituting Tn and
taccum to Eq. (11) gives  (12)since
 and the
instability condition requires
and the
instability condition requires  , the ratio in
the brackets is
, the ratio in
the brackets is  and one can take
 (13)(in what follows we
drop the index “max” in Rd).
(13)(in what follows we
drop the index “max” in Rd).
Assuming that
R1/Rd ≪ 1, the
luminosity at outburst maximum can be approximated as (Frank
et al. 2002)  (14)where
R1 is a white dwarf radius and M1
its mass. The luminosity at minimum light can be estimated from the model as
(14)where
R1 is a white dwarf radius and M1
its mass. The luminosity at minimum light can be estimated from the model as  (15)where
 (Idan et al. 1999).
The amplitude An is the difference between the magnitudes at
maximum MV,max and minimum
MV,min given by  (16)where
 is the difference
between the bolometric corrections at maximum and minimum. From Eqs. (13)–(15) we thus get
is the difference
between the bolometric corrections at maximum and minimum. From Eqs. (13)–(15) we thus get 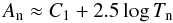 (17)where
 (18)The last step is to
estimate the bolometric corrections BCmax and
BCmin.
(18)The last step is to
estimate the bolometric corrections BCmax and
BCmin.
From the definition,
BCmax = Mbol,max − MV,max.
Following Smak (1989) we calculate the visual
luminosity at maximum LV,max with spectral
energy distribution of a black body disc integrated over the visual band frequencies. The
luminosity LV,max (and so
BCmax) depends on
M1, R1,
Rd and .
The bolometric correction BCmin can be
estimated from the spectral energy distribution calculated for quiescent disc models with
effective temperature ≲ 5000 K. We used spectra calculated by Irit Idan (private
communication; see Idan et al. 2010). Based on that
we assumed BCmin ≈ −0.4.
Equation (17) does not correspond exactly to the K-P relation (see Eqs. (10), (19)). The slope of the theoretical relation is always 2.5 (by construction) as compared with ~2 obtained from fits to observations. Considering the typical spread of parameters, C1 is contained between ~−1.0 and ~1.2 in hydrogen-dominated discs, and is between ~−0.2 and 1.3 in helium discs (see Table 3), to be compared with C1 between 0.3 and 2.0 for the K-P relation. Considering the very large scatter of observational data, this can be considered a fairly satisfactory result. This is only true of the theoretical relation obtained assuming αh = 0.2. The same relation with αh = 0.01 gives a totally unacceptable representation of the An(Tn) relation, thus confirming the conclusion of the previous sections that αh ≈ 0.2. (Compare models 1 and 3 to see how the K-P relation changes when αh is decreased from αh = 0.2 to = 0.01 in a solar disc.) The various An(Tn) relations are plotted in Fig. 5. We also marked on this diagram the values of An(Tn) for a subset of dwarf novae and outbursting AM Cn stars.
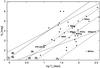 |
Fig. 5 Various An(Tn) relations. Numbers in brackets above the lines correspond to the row numbers in Table 3. The solid lines (2) and (5) correspond respectively to the “lower and upper limits” (see text) deduced from the theoretical relation for solar-aboundance discs with αh = 0.2 (C1 = −0.95 and 1.2). Helium disc theoretical relations are represented by the dotted lines (4) and (6) (C1 = 0.1 and 1.3). Solid lines 1 and 3 illustrate the αh dependence of the An(Tn) relation: for the same binary parameters, they correspond to αh = 0.01 and αh = 0.2, respectively. The upper and lower uncertainty of observational K-P relation fitted to the systems are marked with thick, dashed lines. The sample of binaries marked on the plot consists of U Gem-type systems listed in Table 1 (full circles and asteriks), AM CVn systems: PTF1J0719, CR Boo and V803 Cen (both in cycling state outbursts) (open circles) and SU UMa stars (normal outbursts only, full squares) from Ak et al. (2002) and updated Cataclysmic Binaries Catalog (Ritter & Kolb 2003). |
The sample of the systems presented in Fig. 5 consists of U Gem-type binaries taken from Ak et al. (2002) and listed in Table 1, SU UMa-type binaries taken from Ak et al. (2002) (also listed in Table 1) and from the updated Cataclysmic Binaries Catalog (Ritter & Kolb 2003) and three AM CVn-type stars for which An and Tn were measured from their light-curves. For CR Boo and V803 Cen the measured An and Tn relate to the outbursts in the cycling state (Patterson et al. 2000).
In our sample 15 systems out of 43 are the same as used by Warner (2003). The linear fit to our sample gives  (19)Upper and lower
uncertainties of this relation are marked in Fig. 5.
(19)Upper and lower
uncertainties of this relation are marked in Fig. 5.
Some of the U Gem-type binaries in Fig. 5 are marked with asterisks and their names as examples to show how observed systems correspond to the theoretical lines. For the same purpose the name of one of AM CVn stars is shown on the plot.
The independence of the theoretical K-P relation from
is the consequence of the assumption since
does not depend on
Ṁtr. Systems with larger (more extended) discs and more
massive M1 have higher An for a
given Tn than systems with small discs or less massive primaries
(compare lines (2)−(5), (4)−(6)).
Despite the simplifications and approximations assumed in the derivation, the theoretical K-P relation follows the observational data reasonably well. One concludes that normal dwarf nova outbursts are indeed the results of filling and emptying of an accretion disc, as assumed in the model. The parameter that has the deciding influence on the recurrence time and amplitude of normal outbursts is the disc’s extent.
5. Conclusions
As in S99, the main conclusion of the present paper is that in ionized dwarf-nova accretion discs the viscosity parameter αh ≈ 0.2. The same conclusion is presumably also true for helium-dominated discs in outbursting AM CVn stars, although there the statistics on which it is based are fairly poor. Although there is no evidence that the value of αh is universal, it can be firmly established that, even if it varies over the cataclysmic variable population, it cannot be as low as 0.01, the value resulting from numerical simulations of the MRI, which is the mechanism that is supposed to drive accretion in hot Keplerian discs. Therefore it is not preposterous to suggest that solving this discrepancy between observations and theory should become the main subject of interest of researchers studying disc accretion mechanisms4.
In U Gem itself, one superoutburst has been observed (e.g. Mason et al. 1988; Smak & Waagen 2004).
S99 uses M1 and M2 (which define the orbital period of a semi-detached binary system) as the input parameters and the mean disc radius ⟨ Rd ⟩ , while in the Hameury et al. (1998) code, the input is M1 and ⟨ Rd ⟩ . Smak defines only one value of α, while we take as the input parameters both αh and αc.
We follow here the Menou et al. (1999) notation according to which vF is not the front velocity but the gas velocity at the front. The ratio of the gas velocity at the cooling front to the cooling front velocity is typically ~2.
After the submission of the present article, a paper on this subject by Latter & Papaloizou (2012) has been posted on astro-ph.
Acknowledgments
We are grateful to the referee Ulf Torkelsson for criticism that helped improve our paper. This work has been supported the Polish MNiSW grants PSP/K/PBP/000392, N N203 380336, the Polish National Science Center grant UMO-2011/01/B/ST9/05439 and the French Space Agency CNES. IK acknowledges the IAP’s kind hospitality.
References
- Ak, T., Ozkan, M. T., & Mattei, J. A. 2002, A&A, 389, 478 [NASA ADS] [CrossRef] [EDP Sciences] [Google Scholar]
- Bailey, J. 1975, J. British Astron. Assoc., 86, 30 [Google Scholar]
- Balbus, S. A., & Hawley, J. F. 1998, AIP Conf. Ser., 431, 79 [NASA ADS] [CrossRef] [Google Scholar]
- Bath, G. T., & Shaviv, G. 1978, MNRAS, 183, 515 [NASA ADS] [Google Scholar]
- Dubus, G., Hameury, J.-M., & Lasota, J.-P. 2001, A&A, 373, 251 [NASA ADS] [CrossRef] [EDP Sciences] [Google Scholar]
- Eggleton, P. P. 1983, ApJ, 268, 368 [NASA ADS] [CrossRef] [Google Scholar]
- Frank, J., King, A., & Raine, D. J. 2002, Accretion Power in Astrophysics (Cambridge University Press) [Google Scholar]
- Gilliland, R. L. 1982, ApJ, 263, 302 [NASA ADS] [CrossRef] [Google Scholar]
- Hameury, J.-M., Lasota, J.-P., & Huré, J.-M. 1997, MNRAS, 287, 937 [NASA ADS] [CrossRef] [Google Scholar]
- Hameury, J.-M., Menou, K., Dubus, G., Lasota, J.-P., & Huré, J.-M. 1998, MNRAS, 298, 1048 [NASA ADS] [CrossRef] [Google Scholar]
- Hirose, S., Krolik, J. H., & Blaes, O. 2009, ApJ, 691, 16 [NASA ADS] [CrossRef] [Google Scholar]
- Idan, I., Lasota, J. P., Hameury, J.-M., & Shaviv, G. 1999, Phys. Rep., 311, 213 [NASA ADS] [CrossRef] [Google Scholar]
- Idan, I., Lasota, J.-P., Hameury, J.-M., & Shaviv, G. 2010, A&A, 519, A117 [NASA ADS] [CrossRef] [EDP Sciences] [Google Scholar]
- King, A. R., Pringle, J. E., & Livio, M. 2007, MNRAS, 376, 1740 [NASA ADS] [CrossRef] [Google Scholar]
- Kotko, I., Lasota, J.-P., Dubus, G., & Hameury, J.-M. 2012, A&A, 544, A13 [NASA ADS] [CrossRef] [EDP Sciences] [Google Scholar]
- Kukarkin, B. W., & Parenago, P. P. 1934 Var. Star. Bull., 4, 44 [Google Scholar]
- Lasota, J.-P. 2001, New A Rev., 45,449 [Google Scholar]
- Lasota, J.-P., Dubus, G., & Kruk, K. 2008, A&A, 486, 523 [NASA ADS] [CrossRef] [EDP Sciences] [Google Scholar]
- Latter, H. N., & Papaloizou, J. C. B. 2012, MNRAS, accepted [arXiv:1207.4727] [Google Scholar]
- Levitan, D., Fulton, B. J., Groot, P. J., et al. 2011, ApJ, 739, 68 [NASA ADS] [CrossRef] [Google Scholar]
- Mason, K. O., Cordova, F. A., Watson, M. G., & King, A. R. 1988, MNRAS, 232, 779 [NASA ADS] [CrossRef] [Google Scholar]
- Menou, K., Hameury, J.-M., & Stehle, R. 1999, MNRAS, 305, 79 [Google Scholar]
- Menou, K., Hameury, J.-M., Lasota, J.-P., & Narayan, R. 2000, MNRAS, 314, 498 [NASA ADS] [CrossRef] [Google Scholar]
- Meyer, F., & Meyer-Hofmeister, E. 1984, A&A, 132, 143 [NASA ADS] [Google Scholar]
- Nauenberg, M. 1972, ApJ, 175, 417 [NASA ADS] [CrossRef] [Google Scholar]
- Patterson, J., Walker, S., Kemp, J., et al. 2000, PASP, 112, 625 [NASA ADS] [CrossRef] [Google Scholar]
- Payne-Gaposchkin, C. 1957, The Galactic Novae (North-Holland Publishing Company and Interscience Publishers), Chap. 8 [Google Scholar]
- Payne-Gaposchkin, C. 1977, Novae and Related Stars, eds. M. Friedjung, & D. Dordrecht (Reidel Publishing Co.), Astrophys. Space Sci. Lib., 65, 3 [Google Scholar]
- Ritter, H., & Kolb, U. 2003, A&A, 404, 301 [NASA ADS] [CrossRef] [EDP Sciences] [Google Scholar]
- Shakura, N. I., & Sunyaev, R. A. 1973, A&A, 24, 337 [NASA ADS] [Google Scholar]
- Smak, J. 1984a, Acta Astron., 34, 161 [NASA ADS] [Google Scholar]
- Smak, J. 1984b, PASP, 96, 5 [NASA ADS] [CrossRef] [Google Scholar]
- Smak, J. 1989, Acta Astron., 39, 201 [NASA ADS] [Google Scholar]
- Smak, J. 1999, Acta Astron., 49, 391 (S99) [NASA ADS] [Google Scholar]
- Smak, J. 2001, Acta Astron., 51, 279 [NASA ADS] [Google Scholar]
- Smak, J. 2005, Acta Astron., 55, 315 [NASA ADS] [Google Scholar]
- Smak, J. 2008, Acta Astron., 58, 55 [NASA ADS] [Google Scholar]
- Smak, J. 2009a, Acta Astron., 59, 89 [NASA ADS] [Google Scholar]
- Smak, J. 2009b, Acta Astron., 59, 103 [NASA ADS] [Google Scholar]
- Smak, J. 2009c, Acta Astron., 59, 109 [NASA ADS] [Google Scholar]
- Smak, J. 2009d, Acta Astron., 59, 121 [NASA ADS] [Google Scholar]
- Smak, J., & Waagen, E. O. 2004, Acta Astron., 54, 433 [NASA ADS] [CrossRef] [Google Scholar]
- Sorathia, K. A., Reynolds, C. S., Stone, J. M., & Beckwith, K. 2012, ApJ, 749, 189 [NASA ADS] [CrossRef] [Google Scholar]
- van Paradijs, J. 1983, A&A, 125, L16 [NASA ADS] [Google Scholar]
- van Paradijs, J. 1985, A&A, 144, 199 [NASA ADS] [Google Scholar]
- Warner, B. 2003, Cataclysmic Variable Stars, Cambridge Astrophys. Ser., 28 [Google Scholar]
Appendix A: Critical parameters for solar composition discs
The method of obtaining the formulae and the formulae themselves can be found in Lasota et al. (2008).
For the solar composition hydrogen, helium and metal mass fractions
X = 0.7 Y = 0.28 Z = 0.02
one obtains from fits to S-curves 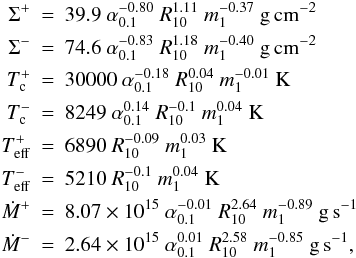 (A.1)where
Σ ± are the critical surface densities for the hot (+) and cold (−)
thermal-equilibrium solutions. Similarly,
(A.1)where
Σ ± are the critical surface densities for the hot (+) and cold (−)
thermal-equilibrium solutions. Similarly,  ,
,
 are the
critical values of mid-plane and effective temperatures, while Ṁ ±
correspond to critical accretion rates, m1 is the primary mass
in solar units and R10 is the radius in units of
1010 cm.
are the
critical values of mid-plane and effective temperatures, while Ṁ ±
correspond to critical accretion rates, m1 is the primary mass
in solar units and R10 is the radius in units of
1010 cm.
All Tables
Six sets of parameters for which the theoretical K-P relation has been calculated.
All Figures
|
Fig. 1 The τdec–Rd,max relation. Filled symbols: U Gem-type systems (circles), normal outbursts of SU UMa-type systems (diamonds), and PTF1J0719 (square). Open symbols: models with αh = 0.1 (circles), αh = 0.2 (squares), αh = 0.3 (triangles). The dotted line - linear fit to the observational data (filled symbols) in the form τdec = A1Rd,max, with A1 = 0.48. (For the sake of clarity models with αh = 0.05 were not plotted.) |
| In the text | |
|
Fig. 2 The W-Rd,max relation. Filled symbols: U Gem-type systems (circles), normal outbursts of SU UMa-type systems (diamonds), and PTF1J0719 (square). Open symbols: models with αh = 0.1 (circles), αh = 0.2 (squares), αh = 0.3 (triangles). The dotted line – linear fit to the observational data (filled symbols) with a coefficient C1 = 1.496. (For the sake of clarity models with αh = 0.05 were not plotted.) |
| In the text | |
|
Fig. 3 Top: evolution of the Σ profile during the propagation of the
cooling front. Numbers next to the lines stand for the subsequent moments of the front
propagation (1 is near the moment of the inset of the cooling front).
Bottom: evolution of the |
| In the text | |
|
Fig. 4 Changes of the disc mass Mdisc (top),
magnitude (middle), and mass accretion rate
|
| In the text | |
|
Fig. 5 Various An(Tn) relations. Numbers in brackets above the lines correspond to the row numbers in Table 3. The solid lines (2) and (5) correspond respectively to the “lower and upper limits” (see text) deduced from the theoretical relation for solar-aboundance discs with αh = 0.2 (C1 = −0.95 and 1.2). Helium disc theoretical relations are represented by the dotted lines (4) and (6) (C1 = 0.1 and 1.3). Solid lines 1 and 3 illustrate the αh dependence of the An(Tn) relation: for the same binary parameters, they correspond to αh = 0.01 and αh = 0.2, respectively. The upper and lower uncertainty of observational K-P relation fitted to the systems are marked with thick, dashed lines. The sample of binaries marked on the plot consists of U Gem-type systems listed in Table 1 (full circles and asteriks), AM CVn systems: PTF1J0719, CR Boo and V803 Cen (both in cycling state outbursts) (open circles) and SU UMa stars (normal outbursts only, full squares) from Ak et al. (2002) and updated Cataclysmic Binaries Catalog (Ritter & Kolb 2003). |
| In the text | |
Current usage metrics show cumulative count of Article Views (full-text article views including HTML views, PDF and ePub downloads, according to the available data) and Abstracts Views on Vision4Press platform.
Data correspond to usage on the plateform after 2015. The current usage metrics is available 48-96 hours after online publication and is updated daily on week days.
Initial download of the metrics may take a while.