Fig. 4
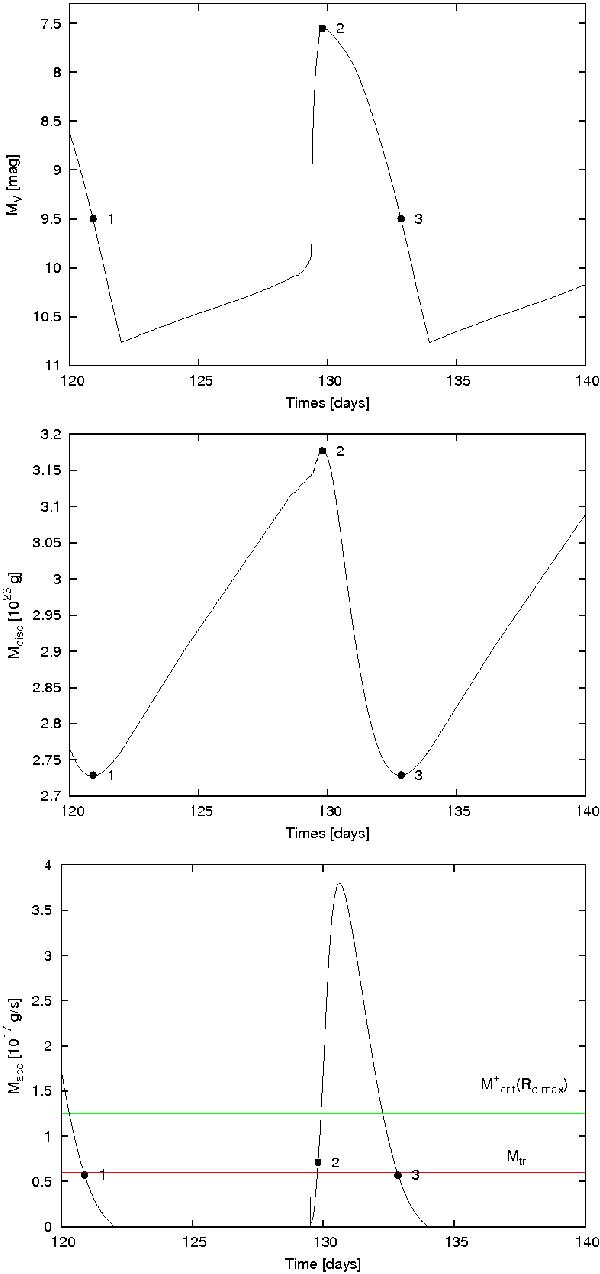
Changes of the disc mass Mdisc (top),
magnitude (middle), and mass accretion rate
 at Rin (bottom) during one outburst
cycle. The horizontal red line at the
Ṁaccr(t) plot is the constant mass
transfer rate
at Rin (bottom) during one outburst
cycle. The horizontal red line at the
Ṁaccr(t) plot is the constant mass
transfer rate  ,
and the horizontal green line is
,
and the horizontal green line is  for this model. The
parameters of the model are αh = 0.2,
αc = 0.05,
M1 = 1.0 M⊙,
Ṁtr = 6.0 × 10¹⁶ g/s,
and ⟨ Rd ⟩ = 1.2 × 1010 cm. The point
number 1 on all three plots refers to the point where the mass accumulation in the
disc starts, point 2 is where the mass depletion from the disc starts, and point 3 is
the end of this cycle when the mass starts to accumulate in the disc again.
for this model. The
parameters of the model are αh = 0.2,
αc = 0.05,
M1 = 1.0 M⊙,
Ṁtr = 6.0 × 10¹⁶ g/s,
and ⟨ Rd ⟩ = 1.2 × 1010 cm. The point
number 1 on all three plots refers to the point where the mass accumulation in the
disc starts, point 2 is where the mass depletion from the disc starts, and point 3 is
the end of this cycle when the mass starts to accumulate in the disc again.
Current usage metrics show cumulative count of Article Views (full-text article views including HTML views, PDF and ePub downloads, according to the available data) and Abstracts Views on Vision4Press platform.
Data correspond to usage on the plateform after 2015. The current usage metrics is available 48-96 hours after online publication and is updated daily on week days.
Initial download of the metrics may take a while.