Fig. 3
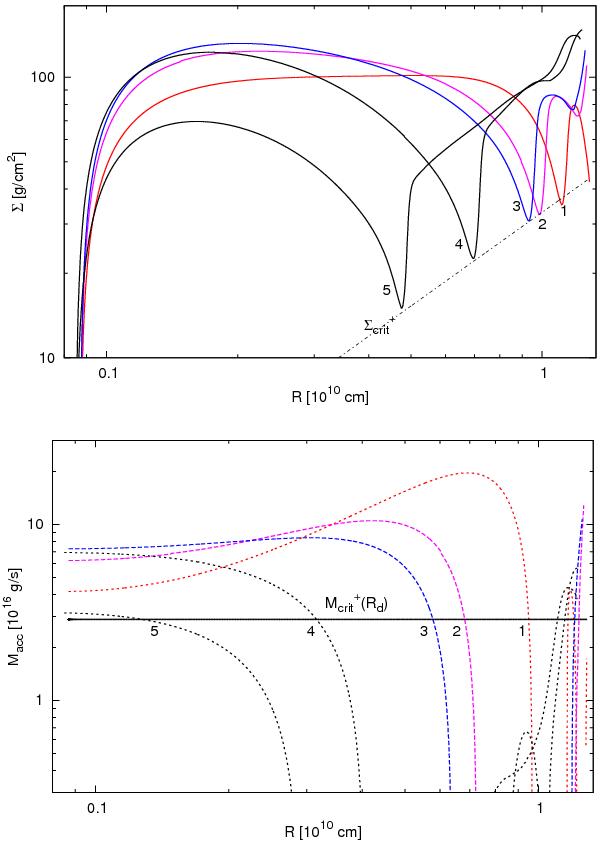
Top: evolution of the Σ profile during the propagation of the
cooling front. Numbers next to the lines stand for the subsequent moments of the front
propagation (1 is near the moment of the inset of the cooling front).
Bottom: evolution of the  profile. The numbers correspond to the same time points as those in Σ.
Current usage metrics show cumulative count of Article Views (full-text article views including HTML views, PDF and ePub downloads, according to the available data) and Abstracts Views on Vision4Press platform.
Data correspond to usage on the plateform after 2015. The current usage metrics is available 48-96 hours after online publication and is updated daily on week days.
Initial download of the metrics may take a while.