Free Access
Fig. C.1
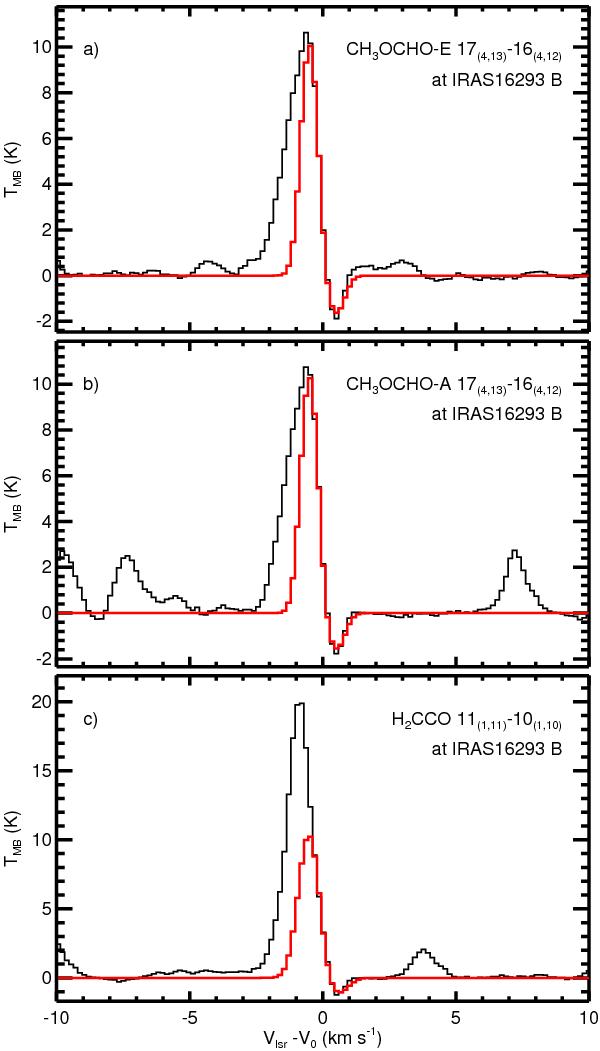
Molecular line spectra from the ALMA data toward the continuum peak of I16293B. In each panel, a red line shows the best two-layer model of infall fit for each spectrum. The best-fit model parameters are listed in Table 1.
Current usage metrics show cumulative count of Article Views (full-text article views including HTML views, PDF and ePub downloads, according to the available data) and Abstracts Views on Vision4Press platform.
Data correspond to usage on the plateform after 2015. The current usage metrics is available 48-96 hours after online publication and is updated daily on week days.
Initial download of the metrics may take a while.