Fig. 4
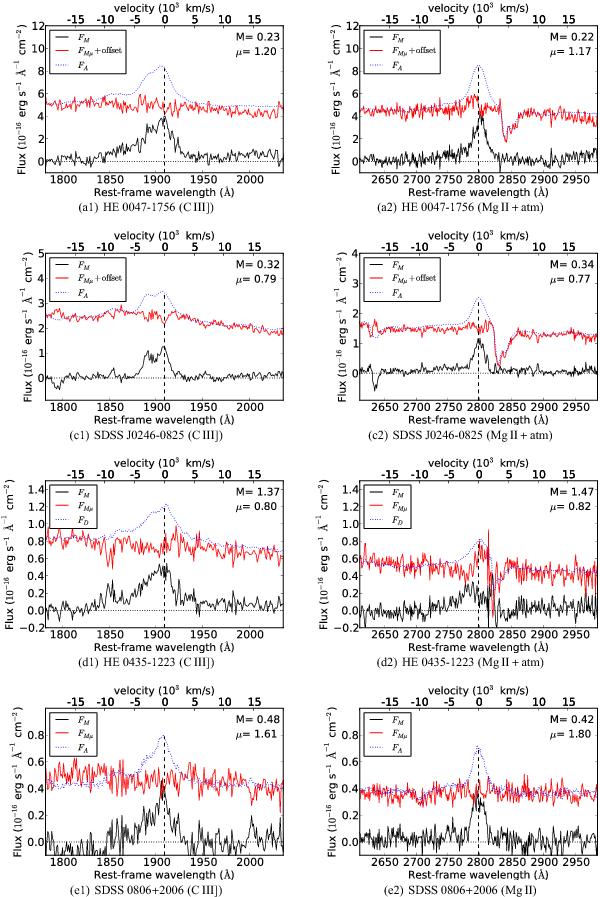
Macro-micro decomposition (MmD) around the main emission lines. In each panel, we show the part of the line profile which is only macrolensed, FM, and the part of the line profile which is both macro- and micro-lensed, FMμ. The spectrum of Image #2 (F2 = FM + FMμ) is superimposed (dotted line). The vertical dotted line denotes the rest wavelength of the emission line (using zs from Table 1). The values of M and μ are given for each decomposition (Sect. 4.1). FMμ contains the micro-magnified continuum and, quite often, a part of the emission line profiles, while FM contains the bulk of the emission lines unaffected by microlensing.
Current usage metrics show cumulative count of Article Views (full-text article views including HTML views, PDF and ePub downloads, according to the available data) and Abstracts Views on Vision4Press platform.
Data correspond to usage on the plateform after 2015. The current usage metrics is available 48-96 hours after online publication and is updated daily on week days.
Initial download of the metrics may take a while.