Fig. 1
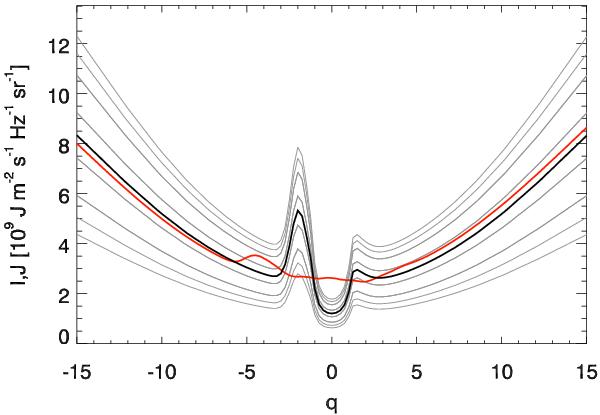
Plots of the radiation field used in the test computation as function of the reduced frequency q. Grey curves: intensity for different directions in the observer’s frame. Black curve: angle-averaged radiation field in the observer’s frame. Red curve: angle-averaged radiation field in the rest frame of a gas parcel moving with a velocity (ux,uy,uz) = (0,1,3) in units of the Doppler speed.
Current usage metrics show cumulative count of Article Views (full-text article views including HTML views, PDF and ePub downloads, according to the available data) and Abstracts Views on Vision4Press platform.
Data correspond to usage on the plateform after 2015. The current usage metrics is available 48-96 hours after online publication and is updated daily on week days.
Initial download of the metrics may take a while.