| Issue |
A&A
Volume 543, July 2012
|
|
|---|---|---|
| Article Number | A116 | |
| Number of page(s) | 5 | |
| Section | Extragalactic astronomy | |
| DOI | https://doi.org/10.1051/0004-6361/201219114 | |
| Published online | 06 July 2012 | |
On the redshift of the bright BL Lacertae object PKS 0048-097
1 Università degli Studi dell’Insubria, via Valleggio 11, 22100 Como, Italy
e-mail: This email address is being protected from spambots. You need JavaScript enabled to view it.
2 INAF – Osservatorio Astronomico di Brera, via Bianchi 46, 23807 Merate (LC), Italy
3 INAF – Osservatorio Astronomico di Padova, Vicolo dell’ Osservatorio 5, 35122 Padova, Italy
4 INAF – Istituto Nazionale di Astrofisica and INFN, Istituto Nazionale di Fisica Nucleare, Italy
5 Max-Planck-Institut fur Astronomie, Konigstuhl 17, 69117 Heidelberg, Germany
6 Finnish Centre for Astronomy with ESO (FINCA), University of Turku, Väisäläntie 20, 21500 Piikkiö, Finland
Received: 25 February 2012
Accepted: 26 April 2012
Abstract
Aims. We attempt to determine the spectroscopic redshifts of bright BL Lac objects, which have proven difficult to measure.
Methods. We use the spectra acquired using the newly available spectrograph X-Shooter at the European Southern Observatory Very Large Telescope, which combines high resolution with a large wavelength range, to obtain ultraviolet to near-infrared spectra of BL Lacs.
Results. Our observations of PKS 0048-097 detect three emission lines, which permit us to derive a redshift z = 0.635. Moreover, we discover a Mg II absorption system at z = 0.154 that is associated with a foreground spiral galaxy a 50 kpc of projected distance.
Conclusions. The measured redshift allows us to discuss the optical beaming factor and the absorption of the high energy spectrum by the extragalactic background light.
Key words: BL Lacertae objects: individual: PKS 0048-097 / galaxies: active
© ESO, 2012
1. Introduction
PKS 0048-097 (mV ~ 15.5) is a bright, strongly variable (Pica & Smith 1983) and well-studied BL Lac object (Wills et al. 1992; Falomo et al. 1993, 1994; Stickel et al. 1993). Despite many spectroscopical studies (Stickel et al. 1993; Sbarufatti et al. 2006), it remains one of the few bright sources with an unknown spectroscopic redshift. Imaging studies of the source have similarly been unable to detect its host galaxy (Falomo 1996). Moreover, the upper limits to the brightness of the host galaxy derived from optical and near-infrared (NIR) imaging imply lower limits to the redshift of z > 0.3, or even z > 0.5 (Falomo 1996; Kotilainen et al. 1998).
Stimulated by the availability of new spectroscopical instrumentation (ESO X-Shooter, Vernet et al. 2011), we have collected optical to NIR spectra of the object to detect very faint features over a large spectral range.
The paper is organized as follows. Our observations and data reduction are described in Sect. 2. Our main spectroscopical results are reported in Sect. 3, where we also comment on our detection of a Mg II intervening system that revised our understanding of the close enviroment of the BL Lac. Our discussion and conclusions are given in Sect. 4. Throughout the paper, we consider the cosmological parameters H0 = 70 km s-1 Mpc-1, Ωm = 0.27, ΩΛ = 0.73.
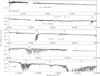 |
Fig. 1 PKS 0048-097 overall mean spectrum. Atmospheric absorption are labelled by ⊕ while calibration artefacts (detectable in the two-dimensional image of the spectrum) are marked with Δ. Emission lines above ~3σ confidence intervals of the S/N of the spectrum are marked with a single vertical line. The expected position of Hβ at z = 0.635 is marked with a dashed line. |
2. Observations and data reduction
We obtained UVB (3100−5500 Å), optical (5600−10 000 Å), and NIR (10 100−15 000 Å) spectra of the target using the ESO Very Large Telescope (UT2 – Kueyen) equipped with X-Shooter in service mode. Two independent spectra were secured using the nodding configuration (NOD) for the instrument (see Table 1 for detailed information).
Journal of observations of PKS 0048-097.
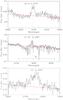 |
Fig. 2 PKS 0048-097 [OII] emission line at 6096 Å, [O III] at 8189 Å polluted by many resolved atmospheric absorption, and Hα emission line at 10751 Å. The vertical dotted lines represent the expected position of the three emission lines assuming the redshift z = 0.635, while the dashed one indicates the position of the barycenter. The red dotted line is the fit to the continuum. |
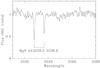 |
Fig. 3 PKS 0048-097 Mg II absorption features at z = 0.154 associated with a spiral galaxy a 50 kpc of projected distance from the BL Lac. |
Data reduction was carried out using the X-Shooter Data Reduction Pipeline (version 1.3.7, see Goldoni 2011) in polynomial mode adopting the configuration recommended by ESO. In particular, for each observation, we calculated the master bias frames and master flat frames for each channel carefully selecting the proper slit values (see Table 1). We also obtained the bidimensional mapping required by the pipeline stack to resample the echelle orders. Finally, for each channel, we computed the sensitivity functions required by the pipeline to calibrate the spectra in flux. We normalized in relative units the obtained spectra to proper juxtapose the three arms. The reduction of the data and the next extraction and calibration of the spectrum was performed for the two individual exposures (see above). Since no significant spectral differences were apparent between the two spectra we averaged them in order to improve the signal-to-noise ratio (S/N).
In Fig. 1, we show the mean spectrum of PKS 0048-097. The continuum is clearly dominated by the contribution of non-thermal emission, which can be described by a power law of the form F(λ) = λ − α (α ~ 0.9). In addition to many telluric absorption lines, we clearly detect the intervening Galactic absorption of Ca II (EW 0.16 Å − 0.05 Å) and Na I (EW 0.10 Å − 0.07 Å). The flux calibration was verified using the relative photometric calibration of the acquisition image. The R band magnitude of PKS 0048-097 is found to be 17.3 ± 0.3, which corresponds to a low brightness of the source. In the literature, the R magnitude of the source is reported to be between 14.74 and 16.22 (Fan & Lin 2000; see also REM archives, Angela Sandrinelli, priv. comm.). The combination of the high quality instrumentation, in terms of throughput and spectral resolution, and the low brightness of the source clearly favored the detection of the faint emission lines.
3. Results
We searched for intrinsic emission or absorption features above or below ~3σ S/N of the spectrum (see Table 1) with the additional condition that the features are clearly detectable in both individual spectra and do not correspond to obvious defects in the two-dimensional image. This procedure detected three emission lines (see Figs. 1 and 2 and Table 2) at λ = 6096 Å, λ = 8189 Å, and λ = 10 751 Å. The line at λ = 6096 Å was tentatively detected by Rector & Stocke (2001) (EW 0.3 Å). We note that no previous NIR observation of comparable spectral resolution was present in the literature. We identify the first two lines as [O II] (λ0 = 3727 Å) and [O III] (λ0 = 5007 Å) from which a consistent redshift of z = 0.635 is derived. The third emission line (λ = 10 751 Å) is identified as Hα, which corresponds to z = 0.638. The small velocity difference (~600 km s-1) measured between the redshifts derived from these narrow and broad emission lines is not uncommon in quasars (see e.g. Boroson 2005). We therefore assume that a reliable estimate of the redshift of PKS 0048-097 is z = 0.635.
Measurements of spectral lines observed (referred to the mean spectrum of each arm).
We detect two narrow absorption features at λλ 3228.20 Å 3236.60 Å (see Fig. 3) that we identify as an intervening Mg II absorption system at redshift z = 0.154. To search for objects associated with this absorption, we investigated the environment around the target using a high-resolution deep image of the field, in the R band, obtained with ESO NTT and SUSI (Falomo 1996). The close companion galaxy (mR = 22.5) that is 2.5′′ east of PKS 0048-097 (see panel (a) of Fig. 4) and previously detected by Falomo et al. (1990) is too faint to be associated with the absorption system at z = 0.154 and it is probably a background galaxy. On the other hand, the spiral galaxy G1 (mr = 19.2) at ~23′′ north-west of the BL Lac corresponding to a 50 kpc projected distance at redshift z = 0.154 (Stickel et al. 1993) is the obvious galaxy associated with the observed Mg II absorption. This galaxy (Mr = −20.57) is found to have a disturbed morphology (see panel (b), (c), and (d) of Fig. 4) after model subtraction and a scale length of ~5 kpc. This is a rare case-study of absorption system at low redshift (see e.g. Kacprzak et al. 2011) in which the counterpart can be reliably investigated using an imaging analysis. The column density inferred from the Mg II features by adopting the Voigt profile-fitting method is  .
.
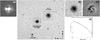 |
Fig. 4 An R band image (FoV of 1.1′ × 1.1′) of the BL Lac object PKS 0048-097 obtained with NTT and SUSI (Melnick 1994) by Falomo (1996) that shows its close enviroment. The spiral galaxy G1 (panel b)) is the Mg II intervening system detected in the very blue part of the spectrum while the galaxy G2 is a foreground object with respect to the absorption. The panel a) in the figure shows a deconvolution of the image. The small object nearby PKS 0048-097 is most probably a background galaxy. Panel c) shows the image of galaxy G1 after the model subtraction, while panel d) reports the average radial brightness profile of galaxy G1. |
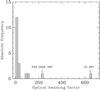 |
Fig. 5 Distribution of optical beaming factors for the BL Lac objects and PKS 0048-097. The extreme values for OJ 287 and PKS 0048-097 are marked by a down arrow. |
4. Beaming and spectral energy distribution of PKS 0048-097
The luminosity of Hα (log Hα ~ 41.93 erg s-1) of PKS 0048-097 is comparable with that of other BL Lac objects (Decarli et al. 2011). To derive the optical beaming factor, defined as the ratio of Lc to Lth, we calculated the expected thermal luminosity of the continuum at 5100 Å (log Lth ~ 43.16 erg s-1, see Decarli et al. 2011) and the continuum luminosity at the same wavelength (log Lc ~ 45.53 erg s-1). In the case of PKS 0048-097, this ratio is ~234. The extreme value of this beaming (which is weaker only than that of OJ 287, see Fig. 5) is consistent with no detection of the host galaxy (Falomo 1996).
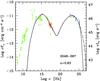 |
Fig. 6 PKS 0048-097 spectral energy distribution. The dashed line is the intrinsic SED model, while the solid line represent the flux absorbed by EBL interaction. Green points are from ASDC archive. Red points represent Swift UVOT and XRT data. FERMI spectra FGL1 and FGL2 are indicated, respectively, by blue and green points. The parameters of the model are γmin = 500, γb = 8.5 × 10³, and γmax = 5 × 10⁵, in addition to n1 = 2, n2 = 4.1, B = 0.46 G, K = 3.7 × 10⁴, R = 8.2 × 1015 cm, and δ = 25. For descriptions of the observations and details of the model, see Tavecchio et al. (2010). |
PKS 0048-097 is a γ-ray emitter observed with FERMI in the band 100 MeV − 10 GeV and it is well fitted by a single power law (α0 = 2.38 ± 0.24). Assuming the extrapolation of this power law to the TeV band, we calculated the expected emission after correction for the EBL absorption (Domínguez et al. 2011) and based on the derived redshift. The EBL interaction reduces the intrinsic flux above 50 GeV by a factor of 1.7 and above 300 GeV by a factor of 60. In Fig. 6, we reported the overall spectral energy distribution (SED) of PKS 0048-097 collected for multifrequency data by Tavecchio et al. (2010). We fitted the data using a standard leptonic one-zone model considering synchrotron and synchrotron self-Compton (SSC) radiation mechanism (see Maraschi & Tavecchio 2003). We report two curves: the dashed line shows the intrinsic emission, while the solid one takes into account the absorption by EBL photons, assuming the estimate of Domínguez et al. (2011). We recall that, despite adopting different approaches and methods, models for the EBL are in significant agreement in the spectral region interesting for absorption of GeV-TeV photons (see discussion and comparison in Domínguez et al. 2011). The one-zone models satisfactorily reproduce the SED above the IR band, below which the emission is self-absorbed in the region that we consider. The emission at lower frequencies is therefore produced in a more distant, transparent, region of the jets, and is irrelevant to the modeling of the high frequency SED. These considerations may be important to take into account when discussing the observability of the source with Cherenkov telescopes.
Acknowledgments
We are grateful to P. Goldoni and E. P. Farina for their comments. Part of this work is based on archival data services provided by the ASI Science Data Center ASDC.
References
- Bonning, E. W., Shields, G. A., & Salviander, S. 2007, ApJ, 666, L13 [NASA ADS] [CrossRef] [Google Scholar]
- Boroson, T. 2005, AJ, 130, 381 [NASA ADS] [CrossRef] [Google Scholar]
- Decarli, R., Dotti, M., & Treves, A. 2011, MNRAS, 413, 39 [NASA ADS] [CrossRef] [Google Scholar]
- Domínguez, A., Primack, J. R., Rosario, D. J., et al. 2011, MNRAS, 410, 2556 [NASA ADS] [CrossRef] [Google Scholar]
- Falomo, R. 1996, MNRAS, 283, 241 [NASA ADS] [Google Scholar]
- Falomo, R., Melnick, J., & Tanzi, E. G. 1990, Nature, 345, 692 [NASA ADS] [CrossRef] [Google Scholar]
- Falomo, R., Bersanelli, M., Bouchet, P., & Tanzi, E. G. 1993, AJ, 106, 11 [NASA ADS] [CrossRef] [Google Scholar]
- Falomo, R., Scarpa, R., & Bersanelli, M. 1994, ApJS, 93, 125 [NASA ADS] [CrossRef] [Google Scholar]
- Fan, J. H., & Lin, R. G. 2000, ApJ, 537, 101 [NASA ADS] [CrossRef] [Google Scholar]
- Ghisellini, G., Tavecchio, F., Foschini, L., et al. 2010, MNRAS, 402, 497 [NASA ADS] [CrossRef] [Google Scholar]
- Goldoni, P. 2011, Astron. Nachr., 332, 227 [NASA ADS] [CrossRef] [Google Scholar]
- Kacprzak, G. G., Churchill, C. W., Barton, E. J., & Cooke, J. 2011, ApJ, 733, 105 [NASA ADS] [CrossRef] [Google Scholar]
- Kotilainen, J. K., Falomo, R., & Scarpa, R. 1998, A&A, 336, 479 [NASA ADS] [Google Scholar]
- Maraschi, L., & Tavecchio, F. 2003, ApJ, 593, 667 [NASA ADS] [CrossRef] [Google Scholar]
- Melnick, J., & Dekker, H. D. S. 1994, EMMI & SUSI: the ESO Multi-Mode Instrument and the Supurb Seeing Imager, ESO operating manual (ESO) [Google Scholar]
- Pica, A. J., & Smith, A. G. 1983, ApJ, 272, 11 [NASA ADS] [CrossRef] [Google Scholar]
- Rector, T. A., & Stocke, J. T. 2001, AJ, 122, 565 [Google Scholar]
- Sbarufatti, B., Treves, A., Falomo, R., et al. 2006, AJ, 132, 1 [NASA ADS] [CrossRef] [Google Scholar]
- Stickel, M., Fried, J. W., & Kuehr, H. 1993, A&AS, 98, 393 [NASA ADS] [Google Scholar]
- Tavecchio, F., Ghisellini, G., Ghirlanda, G., Foschini, L., & Maraschi, L. 2010, MNRAS, 401, 1570 [NASA ADS] [CrossRef] [Google Scholar]
- Vernet, J., Dekker, H., D’Odorico, S., et al. 2011, A&A, 536, A105 [NASA ADS] [CrossRef] [EDP Sciences] [Google Scholar]
- Wills, B. J., Wills, D., Breger, M., Antonucci, R. R. J., & Barvainis, R. 1992, ApJ, 398, 454 [NASA ADS] [CrossRef] [Google Scholar]
All Tables
Measurements of spectral lines observed (referred to the mean spectrum of each arm).
All Figures
|
Fig. 1 PKS 0048-097 overall mean spectrum. Atmospheric absorption are labelled by ⊕ while calibration artefacts (detectable in the two-dimensional image of the spectrum) are marked with Δ. Emission lines above ~3σ confidence intervals of the S/N of the spectrum are marked with a single vertical line. The expected position of Hβ at z = 0.635 is marked with a dashed line. |
| In the text | |
|
Fig. 2 PKS 0048-097 [OII] emission line at 6096 Å, [O III] at 8189 Å polluted by many resolved atmospheric absorption, and Hα emission line at 10751 Å. The vertical dotted lines represent the expected position of the three emission lines assuming the redshift z = 0.635, while the dashed one indicates the position of the barycenter. The red dotted line is the fit to the continuum. |
| In the text | |
|
Fig. 3 PKS 0048-097 Mg II absorption features at z = 0.154 associated with a spiral galaxy a 50 kpc of projected distance from the BL Lac. |
| In the text | |
|
Fig. 4 An R band image (FoV of 1.1′ × 1.1′) of the BL Lac object PKS 0048-097 obtained with NTT and SUSI (Melnick 1994) by Falomo (1996) that shows its close enviroment. The spiral galaxy G1 (panel b)) is the Mg II intervening system detected in the very blue part of the spectrum while the galaxy G2 is a foreground object with respect to the absorption. The panel a) in the figure shows a deconvolution of the image. The small object nearby PKS 0048-097 is most probably a background galaxy. Panel c) shows the image of galaxy G1 after the model subtraction, while panel d) reports the average radial brightness profile of galaxy G1. |
| In the text | |
|
Fig. 5 Distribution of optical beaming factors for the BL Lac objects and PKS 0048-097. The extreme values for OJ 287 and PKS 0048-097 are marked by a down arrow. |
| In the text | |
|
Fig. 6 PKS 0048-097 spectral energy distribution. The dashed line is the intrinsic SED model, while the solid line represent the flux absorbed by EBL interaction. Green points are from ASDC archive. Red points represent Swift UVOT and XRT data. FERMI spectra FGL1 and FGL2 are indicated, respectively, by blue and green points. The parameters of the model are γmin = 500, γb = 8.5 × 10³, and γmax = 5 × 10⁵, in addition to n1 = 2, n2 = 4.1, B = 0.46 G, K = 3.7 × 10⁴, R = 8.2 × 1015 cm, and δ = 25. For descriptions of the observations and details of the model, see Tavecchio et al. (2010). |
| In the text | |
Current usage metrics show cumulative count of Article Views (full-text article views including HTML views, PDF and ePub downloads, according to the available data) and Abstracts Views on Vision4Press platform.
Data correspond to usage on the plateform after 2015. The current usage metrics is available 48-96 hours after online publication and is updated daily on week days.
Initial download of the metrics may take a while.