Fig. 2
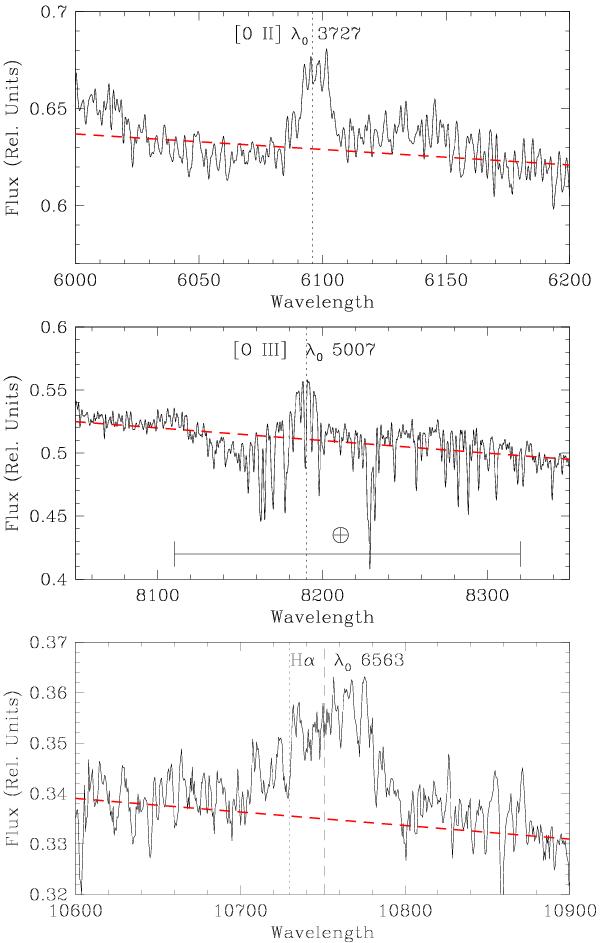
PKS 0048-097 [OII] emission line at 6096 Å, [O III] at 8189 Å polluted by many resolved atmospheric absorption, and Hα emission line at 10751 Å. The vertical dotted lines represent the expected position of the three emission lines assuming the redshift z = 0.635, while the dashed one indicates the position of the barycenter. The red dotted line is the fit to the continuum.
Current usage metrics show cumulative count of Article Views (full-text article views including HTML views, PDF and ePub downloads, according to the available data) and Abstracts Views on Vision4Press platform.
Data correspond to usage on the plateform after 2015. The current usage metrics is available 48-96 hours after online publication and is updated daily on week days.
Initial download of the metrics may take a while.