Fig. 6
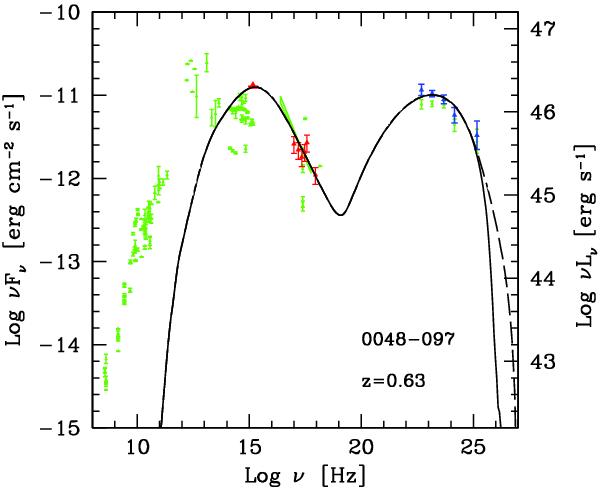
PKS 0048-097 spectral energy distribution. The dashed line is the intrinsic SED model, while the solid line represent the flux absorbed by EBL interaction. Green points are from ASDC archive. Red points represent Swift UVOT and XRT data. FERMI spectra FGL1 and FGL2 are indicated, respectively, by blue and green points. The parameters of the model are γmin = 500, γb = 8.5 × 10³, and γmax = 5 × 10⁵, in addition to n1 = 2, n2 = 4.1, B = 0.46 G, K = 3.7 × 10⁴, R = 8.2 × 1015 cm, and δ = 25. For descriptions of the observations and details of the model, see Tavecchio et al. (2010).
Current usage metrics show cumulative count of Article Views (full-text article views including HTML views, PDF and ePub downloads, according to the available data) and Abstracts Views on Vision4Press platform.
Data correspond to usage on the plateform after 2015. The current usage metrics is available 48-96 hours after online publication and is updated daily on week days.
Initial download of the metrics may take a while.