Fig. 1
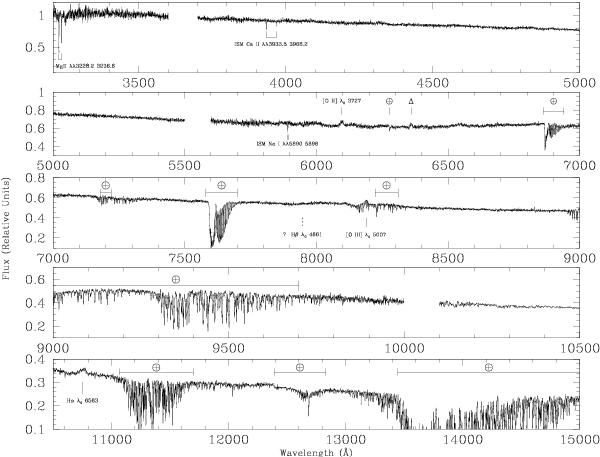
PKS 0048-097 overall mean spectrum. Atmospheric absorption are labelled by ⊕ while calibration artefacts (detectable in the two-dimensional image of the spectrum) are marked with Δ. Emission lines above ~3σ confidence intervals of the S/N of the spectrum are marked with a single vertical line. The expected position of Hβ at z = 0.635 is marked with a dashed line.
Current usage metrics show cumulative count of Article Views (full-text article views including HTML views, PDF and ePub downloads, according to the available data) and Abstracts Views on Vision4Press platform.
Data correspond to usage on the plateform after 2015. The current usage metrics is available 48-96 hours after online publication and is updated daily on week days.
Initial download of the metrics may take a while.