| Issue |
A&A
Volume 543, July 2012
|
|
|---|---|---|
| Article Number | A25 | |
| Number of page(s) | 8 | |
| Section | Planets and planetary systems | |
| DOI | https://doi.org/10.1051/0004-6361/201219039 | |
| Published online | 21 June 2012 | |
Polycyclic aromatic hydrocarbons in protoplanetary disks: emission and X-ray destruction
1 European Southern Observatory, Karl-Schwarzschild-Str. 2, 85748 Garching b. München, Germany
e-mail: This email address is being protected from spambots. You need JavaScript enabled to view it.
2 Department of Physics and Astronomy, University of Kentucky, Lexington, KY 40506-0055, USA
Received: 14 February 2012
Accepted: 13 April 2012
Abstract
We study the polycyclic aromatic hydrocarbon (PAH) emission from protoplanetary disks. First, we discuss the dependence of the PAH band ratios on the hardness of the absorbed photons and the temperature of the stars. We show that the photon energy together with a varying degree of the PAH hydrogenation accounts for most of the observed PAH band ratios without the need to change the ionization degree of the molecules. We present an accurate treatment of stochastic heated grains in a vectorized three dimensional Monte Carlo dust radiative transfer code. The program is verified against results using ray tracing techniques. Disk models are presented for T Tauri and Herbig Ae stars. Particular attention is given to the photo-dissociation of the molecules. We consider beside PAH destruction also the survival of the molecules by vertical mixing within the disk. By applying typical X-ray luminosities the model accounts for the low PAH detection probability observed in T Tauri and the high PAH detection statistics found in Herbig Ae disks. Spherical halos above the disks are considered. We show that halos reduce the observed PAH band-to-continuum ratios when observed at high inclination. Finally, mid-IR images of disks around Herbig Ae disks are presented. We show that they are easier to resolve when PAH emission dominate.
Key words: radiative transfer / protoplanetary disks / infrared: planetary systems / X-rays: stars
© ESO, 2012
1. Introduction
The thermal structure of the surface of protoplanetary disks, and in particular the part which gives rise to the mid-IR emission, may be strongly influenced by the presence of polycyclic aromatic hydrocarbons (PAH). Such molecules have small heat capacities and when they absorb individual photons their temperature fluctuates strongly. Prominent signatures of PAHs are given by detection of their infrared emission bands (see Tielens 2008, for a review). Spatially resolved mid-IR observations give evidence of gaps and spiral structures (Jayawardhana et al. 1998; Augereau et al. 1999). The origin of the PAH emission in protoplanetary disks is confirmed for most of the sources (Habart et al. 2004; Lagage et al. 2006; Doucet et al. 2007; Geers et al. 2007), although PAH emission is observed at several thousands of AU away from the star (Siebenmorgen et al. 1998). The detection rate of PAH bands in protoplanetary disks for T Tauri stars is as low as 10%, for Herbig Ae stars as high as 60% using ISOSWS (Acke & van den Ancker 2004) and goes up to 70% using the superb sensitivity of Spitzer (Acke et al. 2010). In the disks of the more luminous Herbig Be stars the PAH detection rate is below 35% (Acke et al. 2011).
The destruction and survival of PAH in the disks of T Tauri stars is discussed by Siebenmorgen & Krügel (2010, SK10). The PAH detection statistics in protoplanetary disks seems to be related to the excitation mechanism of the PAHs and their destruction, in particular, by hard photons (soft X-rays). The PAH destruction is counter-acted by the survival of the molecules which might be caused by turbulent mixing within the disk. We wish to corroborate these claims by detailed radiative transfer models of protoplanetary disks around T Tauri and Herbig Ae stars.
This paper is structured as follows: we first study the dependence of the strength of PAH bands on the hydrogenation coverage of the molecules and their excitation by photons of different hardness hν (Sect. 2). It is found that the spectral shape of the exciting radiation, in particular when hard photons are involved, should not be neglected when incorporating PAHs in radiative transfer models. A method to include stochastic heated grains such as PAH in a vectorized three dimensional (3D) Monte Carlo (MC) dust radiative transfer model is presented in Sect. 3. As a benchmark test we compare results of the MC procedure to a ray tracing code. Starlight heated, so called passive disks, are treated, which are in hydrostatic equilibrium with gas and dust coupled. Disks are irradiated by the stellar photosphere and by harder photons with energies of several eV up to 2 keV. Vertical mixing of the grains within the disks is considered. Flaring disks are computed with a one dimensional (1D) radiative transfer code provided by Krügel (2008). Disks are also computed with a MC code in 3D, where the combined hydrostatic equilibrium and radiative transfer equations are solved following the procedure by Siebenmorgen & Heymann (2012, SH12). The latter method was developed for disks including equilibrium heated grains. In those disks ring-like structures and gaps appear in the surface structure. In Sect. 4 we present results for disks including stochastic heated dust particles. The spectral energy distributions (SED) are computed for pure disks and disks with dusty halos. The surface brightness distribution in the PAH bands is discussed. Our main findings are summarised in Sect. 5.
2. PAH excitation and band ratios
Variations in the relative strength of the 11.3 μm C–H to the 6.2 and 7.7 μm C=C vibrational modes of PAHs are collected for a large sample of galactic and extragalactic objects by Galliano et al. (2008). The authors conclude that the PAH ionisation degree accommodates the observed variations of the band strengths (Draine 2011). We point out a degeneracy between the ionisation degree and the hydrogenation coverage of the molecules in explaining the band ratios. We consider a single PAH of constant: ionisation degree, abundance (25 ppm [C in PAH]/[H]), and size. The PAH is made up of 150 C and 37 H atoms. The absorption cross section per C atoms in the optical/UV is κ = 7 × 10-18 cm2 with a cut-off at λcut = 0.6 μm (Schutte et al. 1993). We consider 17 emission bands and take for simplicity Lorentzian profiles. Parameters are listed in Siebenmorgen et al. (2001). They are calibrated using ISO spectra of starburst nuclei. The PAH model represent an average between neutral and ionised species. Variations of the band carriers which may be caused by chemical and radiation processing of the molecules in the particular environment are not treated. Nevertheless, in disks around Herbig stars the centers of the PAH features shift to redder wavelengths as the stellar effective temperature decreases (Keller et al. 2008; Peeters et al. 2002). In our models such a shift can only be compensated ad-hoc. Objects with a strong 3.3 μm band are easier fit including an additional smaller PAH component or a PAH size distribution. The influence of a bimodal size distribution and the impact of the hydrogenation degree of PAHs on their mid-IR emission is discussed by Siebenmorgen & Krügel (1992). However, models including a single PAH with size as above appears sufficient to fit SEDs of various galaxies (Siebenmorgen & Krügel 2007). In order to keep computing times of the MC procedure reasonable we treat PAHs of one size.
First we consider PAH excitation by mono-chromatic radiation and study the influence of the hardness of the source spectrum on the band ratios. The emitted radiation is at constant strength (flux F = 100 erg s-1 cm-2), its hardness is varied using photon energy between hν = 2 eV and 50 eV. As F ∝ nγhν is constant the number of photons nγ decreases as the photon energy hν increases. For the same strength of the radiation field the PAH temperature distribution function P(T) becomes narrow when excited by the many soft photons and widens when excited by the few hard photons impinging on the molecule (Fig. 3 in SK10).
Several teams who include PAH in MC codes (Wood et al. 2008; Baes et al. 2011; Robitaille 2011) use pre-computed emissivity profiles of the molecules, respectively P(T). The PAH libraries are computed by scaling a source spectrum of constant spectral shape (Draine & Li 2007; Compiegne et al. 2011) for which the interstellar radiation field of the Galaxy is often used (ISRF, Mathis et al. 1983). The libraries are therefore applicable only to radiation fields in which the strength is varied but its hardness remains close to the ISRF. In Fig. 1 we show that the band ratios of a PAH change within a factor of three when excited by photons of different hardness while they remain constant when excited by the ISRF. Therefore by including PAH into radiative transfer models the frequency of the photons exciting the molecules should be considered. This is in particular true for hard photons of several eV well in excess of the mean photon energy of the ISRF (1.5 eV). In this case the pre-computed band strengths are incorrect by a factor close to what can be read from Fig. 1.
To cover most of the observed variations of the C–H and C=C band ratios as second parameter, the hydrogenation of the molecule given by α = [H]/[C] is used. We vary α between 0.05 and 0.4 which seems within the limit of realistic H coverage of such large molecules. We find that most of the observed values, with exception of those at F(7.7)/F(11.3) > 5, are reasonably covered without having changed the ionisation degree of the PAH (Fig. 1).
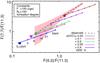 |
Fig. 1 Strength of the CC stretching modes at 6.2 and 7.7 μm relative to the CH out-of-plane bending mode at 11.3 μm. Observed variations (shaded) and mean values (dashed) by Galliano et al. (2008). Full lines at various colors represent band ratios of PAHs with different hydrogenation, α (H/C), and excited by mono-energetic radiation with different hardness (Eγ, as labeled) and constant strength (flux, F). Band ratios derived from PAHs heated by the ISRF are indicated by filled circles and same color index of α. Beside other parameters the degree of ionisation is constant. |
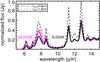 |
Fig. 2 Influence of stellar temperature and cut-off wavelength of the PAH absorption cross section on the IR emission bands. Spectra are normalized to their far-IR peak. |
PAH band ratios calculated for different stellar radiation fields and cut-off wavelengths of the PAH absorption cross section, λcut.
The reflection nebulae NGC 1333, which is excited by an 19 000 K photosphere, and NGC 2068, which is heated by a 11 000 K star, differ in the 7.7/11.3 μm band ratio by 30% (Uchida et al. 2000). With the same stellar temperatures the ratios vary in the model by 15%, which can be increased varying the strength of the radiation field or the PAH parameters. The cut-off in the PAH absorption cross-section is in the optical and moves only slightly to longer wavelength by increasing the size of the molecule. Laboratory measurements show that large neutral (NC > 30), compact ions (NC < 250) or nitrogenated PAHs may absorb up to the near-IR (Salama et al. 1996; Mattioda et al. 2005, 2008). PAH emission spectra are shown in Fig. 2 using our ISM dust model. We vary the temperature of the star and λcut. The stellar flux is constant at F = 100 erg s-1 cm-2. Photons above 13.6 eV are truncated. For λcut = 0.6 μm (2 eV) and in the 5000 K stellar spectrum the PAH absorb every 140 s a photon with mean energy of 2.6 eV, whereas in the harder spectrum, the time between two absorption events is reduced to tabs = 90 s and the mean photon energy equals  eV. The 7.7/11.3 band ratio changes by ≳ 50% for both stellar temperatures (Table 1), so that PAHs appear hotter in hotter stars. The picture changes when λcut is increased to 1.8 μm (0.7 eV). Then tabs and
  changes as detailed in Table 1 and the band ratios vary with stellar temperature by 25% only. The choice of the PAH cross section has a strong influence on the emission spectrum. Unfortunately the cross sections vary by large factors from molecule to molecule.
3. Radiative transfer in 3D including PAHs
The radiative transfer problem is solved for arbitrary dust geometries by a MC scheme developed by Heymann & Siebenmorgen (2012). It includes grains large enough to be in thermal equilibrium with the environment. We first give a brief description of the procedure. Then we present an accurate method to include stochastic heated particles. The new code is verified against computations using ray-tracing methods.
3.1. Large grains
Our MC method considers advantages of different MC techniques (Lucy 1999; Bjorkman & Wood 2001). The computational speed is increased by calculating the flight paths of many photons simultaneously. This is implemented by using vectorized hardware of either computer processing units (CPU) or graphical processing units (GPU). In the procedure a total of N = n Nν photon packages are emitted per second from a source of luminosity L∗. In each of the Nν frequency bins there are n photon packages emitted. Each photon package has a constant energy ε = L∗/N. The model space is a three dimensional Cartesian grid (x,y,z) in which each cube can be divided into a number of subcubes. The flight path of each photon package is traced through the model. A package entering a cell interacts with the dust if the extinction optical depth along the path within the cell is Δτ ≥ −log (ξ), using unified random number ξ. The package is scattered if the dust albedo A > ξ′, using random number ξ′; otherwise it is absorbed. When the package is scattered, it only changes direction. If the package is absorbed a new package of same energy but different frequency ν′ is emitted from the spot of absorption. The emission is isotropic. Each absorption event raises the energy of the cell by ε, and accordingly its dust temperature. In cells with extreme high optical depth photon packages may get trapped and for computational efficiency the modified random walk procedure by Fleck & Canfield (1984) is implemented (Min et al. 2009; Robitaille 2010). The SED is computed by counting photon packets leaving the cloud towards the observer using a large beam. Images are computed by a ray-tracer where the radiative transfer of the line of sight from the observer, or a pixel of the detector plane, through the model cloud is solved using the MC computed dust absorption and scattering events.
3.2. Small grains
Very small grains such as PAHs show strong fluctuations of their enthalpy state whenever they are hit by a photon. Their emission is generally treated statistically by introducing a temperature distribution function P(T)dT which gives the chance of finding an arbitrary particle in a temperature interval [T,T + dT] . Absorption or emission leads to a transition from an initial Ui to a final Uf enthalpy state of the system, which is represented by a transition matrix Afi. For PAH we consider an analytic approximation of the enthalpy U(T) of graphite given by Chase et al. (1985). The enthalpy bins are of width ΔU(T) and binned in constant temperature intervals. Let for a given cell l, a number of nl,ν mono-chromatic photon packets of frequency ν be absorbed by a PAH, then the transition matrix can be computed ![Mathematical equation: \begin{equation} \label{afi.eq} A_{\rm fi} = \left\{ \begin{array}{cl} \displaystyle{K_\nu F \over n_{l, \nu} \ h\nu}{:} &\ \mbox{if} \ |U_{\rm f}-U_{\rm i}- n_{l, \nu} \ h\nu| \le {1\over 2} \Delta U_{\rm f} \\[3mm] 0{:} & \ \mbox{else} \end{array} \right. \/ \end{equation}](/articles/aa/full_html/2012/07/aa19039-12/aa19039-12-eq53.png) (1)where Kν denotes the PAH absorption cross section. In steady state the sum over all k-enthalpy states ∑ AjkPk = 0, and P(T) is computed with the help of the rapid recursion formulae by Guhathakurta & Draine (1989). Examples of P(T) for mono-energetic excited PAHs are discussed by SK10. In some circumstances the distribution function P(T) is rather flat while in others it approaches a δ-function. Therefore we implement an iteration procedure in which the temperature grid of U(T) is carefully adapted to the specific case. This ensures that numerical inconsistencies in particular of the energy balance are avoided. Note that to reduce computing time such an iteration procedure is not included in the MC treatment by Bianchi (2008), who computes P(T) on a fixed temperature grid.
(1)where Kν denotes the PAH absorption cross section. In steady state the sum over all k-enthalpy states ∑ AjkPk = 0, and P(T) is computed with the help of the rapid recursion formulae by Guhathakurta & Draine (1989). Examples of P(T) for mono-energetic excited PAHs are discussed by SK10. In some circumstances the distribution function P(T) is rather flat while in others it approaches a δ-function. Therefore we implement an iteration procedure in which the temperature grid of U(T) is carefully adapted to the specific case. This ensures that numerical inconsistencies in particular of the energy balance are avoided. Note that to reduce computing time such an iteration procedure is not included in the MC treatment by Bianchi (2008), who computes P(T) on a fixed temperature grid.
Stochastic heated grains have been included in MC radiative transfer models with different levels of simplifications. Krügel (2008) describe two ways to treat stochastic heated particles in MC schemes. We follow the one where PAH are only excited by photons which are directly emitted or scattered from the source. A similar approach is taken by Gordon et al. (2001), Misselt et al. (2001), Dullemond et al. (2007). A library approach is considered by Juvela & Padoan (2003), Wood et al. (2008), Baes et al. (2011), and Robitaille (2011), in which P(T) is pre-computed for some radiation fields such as a scaled version of the ISRF. This method reduces the high computational demand required to solve P(T) case by case, however at the expense of a possible computational error in particular for the derived PAH band strengths as discussed in Sect. 2.
Previous MC codes which include PAHs do not include the physics of the dissociation process of the molecules; PAH photo-destruction by a single hard photon is neglected and soft X-rays are not considered. In our scheme we include these effects as described below. Our code is optimised so that photons which are absorbed and re-emitted by dust are assumed not to heat the PAHs. This is a valid approximation as dust emits photons in the IR which are hardly absorbed by a PAH. This allows us to reduce storage and run time requirements.
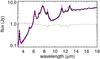 |
Fig. 3 Comparison of the SED of a stellar heated, optically thick (τV = 10) dust sphere of constant density computed with a ray tracing method (Krügel 2008, full line) and the MC code of this work (dashed). The flux ratio between both methods is displayed in gray. |
PAH are implemented in our code as follows: first, the source emits N photon packages and an equilibrium of the MC model is computed by considering the absorption but ignoring the emission of the PAHs. At this point only the number and frequency of the packets which are absorbed by a PAH are saved. Thereafter each cell with  becomes an independent source and we assume that it emits from its center the same number n of photons at smallest frequency ν′ given by:
 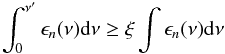 (2)with random number ξ and PAH emissivity
  (3)where
  is the PAH absorption cross section.
One extra complication occurs for cells where PAH dissociate. For nanometer-sized grains such as PAH we consider photo-destruction. It is estimated that a PAH with NC carbon atoms is destroyed (Omont 1986), when the absorbed energy ΔE exceeds a critical energy Ecrit:  (4)The energy ΔE, may be either due to absorption of i) many soft photons or ii) whenever the molecule is hit by a single hard photon. The first condition is only relevant at short distances from the source while the second acts irrespective of that distance. If Eq. (4) is fulfilled and PAHs of cell i dissociate the
  absorbed photon packets are again emitted from the star. We further simplify the method and ignore PAH absorption during the flight path of these photons through the cloud.
3.3. Verification
For equilibrium heated grains the MC code is verified against various one and two dimensional benchmarks (Heymann & Siebenmorgen 2012). For stochastic heated particles we compare results computed by MC against the spheric symmetrical radiative transfer codes by Siebenmorgen (1993) and Krügel (2008). In the latter the radiative transfer problem is solved by a ray tracing method. We find that the SED computed by the MC procedure and the ray tracing code agrees typically to within a few percent ( ≲ 5%). One such comparison is shown in Fig. 3. The dust sphere is heated by a star with luminosity of 1 L⊙ and photospheric temperature of 6000 K, between rin = 3 AU and rout = 90 AU a constant dust density of 1.85 × 10⁻¹⁹ g/cm3 is used. For the large grains we take ISM type dust with parameters as in SH12 and PAHs as of Sect. 2. This gives a dust extinction cross section in the V band of  [cm2/g-dust]. The dust mass of the cloud is 9.53 × 10⁻⁷ M⊙ and the optical depth between rin and rout is τV = 10. The overall SED, including the far-IR emission and the PAH feature strengths of both radiative transfer computations are in good agreement (Fig. 3).
4. Protoplanetary disk models
Protoplanetary disk models are set up similarly to those described in SH12. We consider both photospheric heating and hard radiation components of the star. In addition to large grains we include PAHs. First, the set up of the hydrostatic disk models are described. Then our treatment of the PAH destruction in the disks is outlined and results compared for disks computed in 1D for flaring disks and in 2D by the MC scheme. Models are applied to disks heated by a T Tauri star and a Herbig Ae star. Halos above the disks are considered. The surface brightness in the PAH bands is discussed.
Parameters of the fiducial T Tauri and Herbig Ae disks.
4.1. MC disk models
As fiducial model of the T Tau star we take a mass of 1 M⊙, a luminosity of L ∗ = 2 L⊙, and a photospheric temperature of 4000 K. For Herbig Ae star we use 2.5 M⊙, 50 L⊙ and 104 K (van den Ancker et al. 1997). Soft X-rays (50 eV − 2 keV) are included with luminosities up to 10-4 L∗. The distance is set to 50 pc.
For large grains we take the fluffy grain model of SH12. It includes a power-law size distribution: n(a) ∝ a-3.5, with particle radii between 320 Å ≤ a ≤ 33 μm of composite grains with volume fraction of 34% silicates, 16% carbon, and 50% vacuum. Dust abundances (ppm) are 31 [Si]/[H] and 200 [C]/[H] (Asplund et al. 2009). Optical constants are by Draine (2003) for silicates and Zubko et al. (1996) for carbon. Absorption and scattering cross-sections and the scattering asymmetry factor is computed with the Bruggeman rule. This gives a total mass extinction cross section for the large grains in the optical (0.55 μm) of  [cm2/g-dust] and a gas-to-dust mass ratio of 130. PAH parameters are taken from Sect. 2. Kinetic energy losses by e− are important when dust interacts with energetic photons of critical energy ≳ 100 eV. This effect is not included in the Mie theory and will result in an extra ~ 1/ν decline of the absorption cross section; for detailed computations and size dependence of the critical energy see Dwek & Smith (1996). This correction is applied to the cross sections of all particles.
The disk extends inwards up to the point where porous grains reach 1000 K, or equivalently small interstellar grains would be at about 1500 K. PAH destruction is computed as discussed in Sect. 4.2. The outer disk radius is rout = 22.5 AU for T Tau and 40 AU for Herbig Ae disks. Further out the midplane temperature drop below 30 K and other heating mechanisms may become important. The PAH emission is well constrained within a fraction of rout. Initially we assume that the disk is isothermal in the vertical direction z and the density is given by  (5)with scale height H2 = kTmidr3/GM∗m, surface density Σ(r), molecular mass m = 2.3mp and midplane temperature, Tmid, for which we use a power-law as an initial guess. The height of the disk is set initially to z0 = 4.5H. In models with pure disks the density ρhalo above z > zo is zero and constant when a halo is considered (Table 2). The surface density is adjusted to the optical depth in vertical direction: τ ⊥ = Σ(r)KV = τ1 AU (r/AU)γ with γ = −1 for r ≥ 1 AU and γ = 0.5 otherwise (Min et al. 2011). At 1 AU the vertical optical depth from the surface to the midplane is τ ⊥ (1 AU) = 10 000. This translates to a surface density of Σ(1 AU) = 5 g-dust/cm2 for disks without PAHs, which is close to estimates for the minimum mass of the early solar nebulae (Hayashi 1981), and Σ drops by a factor 4.4 when PAHs are considered.
The disks are in hydrostatic equilibrium in the vertical direction so that the gravitational force is balanced by the pressure gradient  (6)with pressure P = ρkT(z)/m. We solve Eqs. (5) and (6) by an iterative scheme: after a first set up of the disk structure ρ(r,z) by Eq. (5), the temperatures T(r,z) are computed with the MC code. By inserting the temperatures into Eq. (6) a new density structure ρ(r,z) is found. Then with a new MC run T(r,z) are updated and the procedure repeated. After less than a dozen of iterations a stable disk configuration is found.
4.2. PAHs destruction and X-rays
Young low-mass stars, and to a lesser degree intermediate-mass stars, are X-ray emitters. Here we study the influence of hard photons on the appearance of PAH bands in disks. For the destruction of PAHs the process known as unimolecular dissociation is applied (Tielens 2005). A simplified scheme which allows estimating of the distance from the star where the molecules become photo-stable is described in SK10. The threshold energy ΔE (Eq. (4)) to dissociate PAHs by multi-photon absorptions is given by:  (7)where Lν is the frequency dependent luminosity of the star, κν is the absorption cross section per C atom of a PAH and τν is the optical depth from the star to the spot of absorption in the cell. Hard photons can dissociate PAHs at all distances from the source in a time short compared to the life time of the disk. Therefore a PAH survival channel is introduced for which, as a result of turbulence, vertical mixing of the dust within the disk is assumed. From Spitzer spectroscopy Keller et al. (2008) suggest that PAH may be formed by evaporation of icy grain mantles and constantly destroyed and replenished. We crudely simplify the picture and assume that for the size of the largest eddies the average turbulent velocity grows linearly with the sound speed. The turbulent velocity is parametrized
  with sound speed cs. Estimated values for α are often used but highly uncertain. They range from α ~ 0.0001 up to 0.1 (Schräpler & Henning 2004; Youdin & Lithwick 2007), if not otherwise mentioned we use α ~ 10-3. The influence of the choice of α on the PAH survival is discussed in SK10. For a more realistic physical description of the turbulent motions the MC treatment has to be combined with three dimensional hydrodynamical calculations (Armitage 2011, for a review). Excitation of PAHs by stellar photons is to good order within the extinction layer of optical radiation and has thickness ℓ ~ H/2. For vertical velocity v ⊥ = ℓ/texp a PAH is exposed to radiation by a time texp. Using the destruction time tdes, as the time between two hard photon absorption events, the PAH will survive if tdes > texp. Translated into a velocity condition the PAH hit by photons with Ecrit = hνcrit will be destroyed if (Eq. (23) in SK10):
  (8)with fℓ = ℓ/H ~ 0.5. Both PAH destruction conditions of Eqs. (7) and (8) are straight forward to implement into radiative transfer codes which are based on ray-tracing.
By implementing the hard radiation components into the MC code we enter into numerical challenges. The equidistant energy binning of the photospheric component is achieved with 2000 frequencies. However, considering stars with non-negligible far-UV, extreme-UV and X-ray components means increasing the frequency grid to 250 000 bins at the expense of a run time increase by a similar factor (≳100). Therefore we need to simplify the treatment of PAH dissociation by hard photons in the MC code. The energy balance of the dust disk is dominated by the photosphere and the hard radiation components are of small enough luminosity that they play a minor role in the overall disk structure and the temperature of the midplane. Hard radiation plays a major role in computing the PAH destruction zone. The far-UV photons have a mean energy below Ecrit and do not contribute to the condition of Eq. (7). Most of the extreme-UV photons will be absorbed by the gas located well above the height of dust extinction layer (Ercolano et al. 2010). Therefore it is safe to ignore far-UV and extreme-UV radiation components. The detailed spectral variation of X-rays is not relevant for the destruction of PAHs. This allows us to represent X-rays by a mono-chromatic energy which we choose to be at 1 keV. This choice ensures that each X-ray absorption event leads to complete destruction of the molecule. To apply the PAH destruction condition of Eq. (8) for each cell only the total optical depth, τ1 keV remains to be computed. Therefore the survival of PAHs in a cell can be estimated before the time consuming MC run. In cells where PAHs are destroyed, by the condition of Eq. (8), there will be no photon absorption by PAHs.
4.3. T Tauri disks
We compute the SED of hydrostatic disks with PAHs and hard radiation components for T Tauri stars applying three different disk geometries. First, we consider a flaring disk in which the radiative transfer is solved only in the vertical direction. Then we apply the MC code to disks assuming axial symmetry. In the MC models the region above the disk is either free of dust or filled in a halo like configuration.
We apply the one dimensional (1D) radiative transfer code developed by Krügel (2008) of a hydrostatic and geometrically thin disk. The program is applied to the emission of PAHs from disks of Herbig stars by Habart et al. (2004). The disk is symmetric with respect to the midplane at z = 0. The density structure is given in cylindrical coordinates ρ(r,z). Light from the star falls on the disk under a grazing angle αgr so that from everywhere on the disk surface the star is visible (Armitage 2007). For the 1D models we use the flaring geometry by Chiang & Goldreich (1997) set to 3° ≤ αgr ∝ r2/7 ≤ 7°. We present results where the 1D disks are heated by four radiation components of the star (SK10): the photosphere with luminosity of 0.99 L∗ and black body temperature of 4000 K, far-UV with 1% L∗ at 15 000 K, extreme-UV with 0.1% L∗ at 300 000 K and X-rays of up to 2 keV with LX = 10-3.6 L∗ and a spectrum ∝ ν2. We implement into the code the PAH destruction mechanism following conditions of Eqs. (7) and (8).
The SEDs of T Tauri disks including PAHs and heated by hard radiation are computed also by the MC scheme for which parameters of Table 2 are taken. We find that the appearance and non-appearance of PAH bands is predicted in a similar way in both geometries provided by the 1D and the MC model. As shown in Fig. 4, if one considers only the photosphere strong PAH bands appear in the spectra. They weaken when including hard radiation fields of LX = 10-6 L∗ and PAH do not contribute to the emission spectrum for LX ≥ 10-4 L∗. The latter X-ray luminosity can be considered as a lower limit for most T Tauri stars (Preibisch et al. 2006). Our computations corroborate earlier estimates that the non-appearance of PAH bands in spectra of T Tauri stars is connected to the destruction of the molecules by hard radiation (SK10). We verified that X-ray luminosities have little impact on the midplane temperature, nor do they impact the detailed surface structure of the disks. The ring-like structures, their shadows and gaps in the disk surface are preserved as computed by SH12.
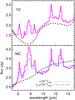 |
Fig. 4 Mid IR emission of T Tau disks with X-ray luminosity of LX = 10-4 L∗ (dashed), LX = 10-6 L∗ (dashed), and LX = 0 (full line). SEDs are computed for flaring disks in “1D” (top) and with MC (bottom). |
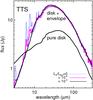 |
Fig. 5 IR emission of T Tau disks with and without dust envelope, viewed nearly (~20°) edge-on. Heating includes X-ray luminosities as indicated. |
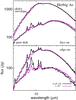 |
Fig. 6 IR emission of a Herbig Ae disks with (magenta) and without (black) dust envelope, viewed nearly face-on (top) or edge-on (bottom). Results for different X-luminosities as indicated. |
4.4. Halos
Residual dust may be left or replenished in a halo at high altitudes above the disk (Vinkovic et al. 2006; Krijt & Dominik 2011). Early models added spherical distributed and optical thin dust emission on top of SEDs computed for pure disks (Miroshnichenko et al. 1999). The MC code allows a self-consistent treatment of the radiative transfer in such a geometry. The halo is filled by large grains and PAHs and is implemented into the code assuming a dust density of ρ(r,z) ≥ ρhalo = 1.5 × 10⁻¹⁸ (g-dust/cm3). This gives an optical depth of the halo of τV ~ 1.5. Resulting SEDs are shown in Fig. 5. The X-ray luminosity is varied using LX = 0, 10-6 L∗, and 10-4 L∗. The dependence of the PAH band strengths on the X-ray luminosity is similar to models without halos (Fig. 4). The halo models appear warmer and have a factor ~3 stronger IR peak emission and at ≲ 6 μm less near IR flux than pure disks. The halo provides additional heating of the disk on top of the direct stellar light and therefore their disk midplane temperature is warmer and shows less structure.
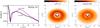 |
Fig. 7 Mid-IR images at 11.3 μm of a disk with (middle) and without (right) PAHs heated by a Herbig Ae star and viewed at 30° from the midplane. Images are normalized to the stellar flux. Color bars are in log(Jy/arcsec2). Left: surface brightness distribution of the images measured as cut from the star. |
4.5. Herbig Ae disks
We present disk models for Herbig Ae stars with parameters of Table 2. Resulting SEDs are computed by the MC scheme and are shown for face-on and edge-on views in Fig. 6. The optical depth of the halo is τV ~ 1.5. The influence of hard radiation on the PAH destruction is studied by applying a X-ray luminosity of LX = 0 and 10-4 L∗, which exceeds the range of 10-5... 10-7 L∗ typically found in Herbig Ae stars (Stelzer et al. 2006). Irrespective of these X-ray luminosities PAH bands are visible in the Herbig Ae disks. This is contrary of what we found for T Tauri disks (Sect. 4.3). At the inner rim of the disks the absolute X-ray flux is more than a factor 10 lower in Herbig stars than in T Tauri stars and PAH survive. If one lowers α by one order of magnitude the PAH band-to-continuum ratio is reduced by 30% and for α = 0 the PAH signatures are absent. We verified that the up and downs in the midplane temperature as well as the ring-like structures, the shadows and gaps in the disk surface are preserved as computed by SH12, irrespectively of the X-ray luminosity or the strengths of the PAH emission.
When the disks are viewed face-on, the PAH feature-to-continuum ratio becomes smaller and even more so when a halo is present. In the latter configuration the emission by large grains outshine the PAH contribution. We noticed a similar effect in disks of T Tauri stars in which the X-ray luminosities are small enough for PAH survival. Therefore, the geometrical distribution of the dust effects the detection probability of PAH features in disks.
The stochastic heating of PAH is rather independent of the distance to the star, a fact first noticed in reflection nebulae (Sellgren et al. 1985). We study how this effect influences the appearance of pure Herbig Ae disks in the mid-IR. The surface brightness distribution in the 11.3 μm band is displayed in Fig. 7 for disks with and without PAHs. The images with PAH emission are brighter than those without PAHs at distances between 6 AU and 10 AU. Otherwise, the emission structure remains the same, except for some broadening of the inner gap in the disk, outside the dust evaporation zone. In both cases the dominant contribution of the emission is coming from the central 2 − 3 AU. Due to the brighter optical luminosities of Herbig Ae stars the PAH are excited at large distances from the star. There the turbulent velocity is larger than the critical velocity for PAH destruction by X-rays, so that the molecules survive (Eq. (8)). For α close to 0 the surface brightness distribution approaches that of disks without PAHs.
5. Conclusion
We study the dependencies of the PAH band ratios by changing the hydrogenation coverage of the molecules and the spectral shape of the exciting radiation field. PAH band ratios vary by a factor three when excited by photons of different hardness. They remain almost constant when excited by the ISRF. Therefore by including PAH into radiative transfer models the frequency of the absorbed photons should be considered.
MC radiative transfer models which treat stochastic heated grains implement different levels of simplifications: temperature distribution functions are often used which are pre-computed for a constant hardness of the exciting radiation, photo-dissociation of the PAHs is not included and hard radiation components are ignored. The MC code presented in this paper considers heating of the PAH by individual photons and photo-destruction of the molecules. We compare our PAH treatment in the MC scheme against a radiative transfer program which is based on ray-tracing. The PAH emission computed by both codes is in good agreement.
The PAH emission in protoplanetary disks is studied for T Tauri and Herbig Ae stars. Dust in the disk is configured either in a slab geometry, in which the radiation transport is solved in vertical direction (1D), or by the MC procedure assuming hydrostatic and radiation balance (SH12). The disks are heated by the stellar photosphere and soft X-rays. Hard photons dissociate PAHs in the disk within a time that is short compared to the lifetime of the disk. Therefore, following SK10, a PAH survival channel is introduced in the radiative transfer programs for which, as a result of turbulence, vertical mixing of the dust within the disk is assumed. We find that the appearance and non-appearance of PAH bands is predicted in a similar way by the 1D and the MC disk models.
We find that stars with X-ray luminosities ≥ 10-4 L ∗ do not display PAH emission features in disks around T Tauri stars whereas PAH are present in disk models of Herbig Ae stars because their absolute X-ray flux is more than a factor 10 lower. Due to the brighter optical luminosities of Herbig Ae stars, the PAH are excited at large distances from the star. There the turbulent velocity is larger than the critical velocity for PAH destruction, so that the molecules survive and PAH emission can be detected. The dependence of the X-ray luminosity on the PAH band ratios is similar in disk with and without halos. However, in disks with halos the PAH band ratios are smaller than in disks without halos. The mid-IR surface brightness appears brighter in the planet forming region of disks with PAH emission than in those without PAHs.
Acknowledgments
We are grateful to Endrik Krügel for helpful comments and for providing his 1D radiative transfer codes.
References
- Acke, B. 2011, in PAHs and the Universe, ed. C. Joblin, & A. G. G. M. Tielens, EAS Publ. Ser., 46, 259 [Google Scholar]
- Acke, B., & van den Ancker, M. E. 2004, A&A, 426, 151 [NASA ADS] [CrossRef] [EDP Sciences] [Google Scholar]
- Acke, B., Bouwman, J., Juhz, A., et al. 2010, ApJ, 718, 558 [NASA ADS] [CrossRef] [Google Scholar]
- Armitage, P. J. 2007, Astrophysics of planet formation (Cambridge: University press) [Google Scholar]
- Armitage, P. J. 2011, ARA&A, 49, 195 [NASA ADS] [CrossRef] [EDP Sciences] [Google Scholar]
- Asplund, M., Grevesse, N., Sauval, A. J., & Scott, P. 2009, ARA&A, 47, 481 [NASA ADS] [CrossRef] [Google Scholar]
- Augereau, J. C., Lagrange, A. M., Mouillet, D., & Mnard, F. 1999, A&A, 350, 51 [Google Scholar]
- Baes, M., Verstappen, J., De Looze, I., et al. 2011, ApJS, 196, 22 [NASA ADS] [CrossRef] [Google Scholar]
- Bianchi, S. 2008, A&A, 490, 461 [NASA ADS] [CrossRef] [EDP Sciences] [Google Scholar]
- Bjorkman, J. E., & Wood, K. 2001, ApJ, 554, 615 [NASA ADS] [CrossRef] [Google Scholar]
- Chase, M. W., Davies, C. A., Downey, J. R., et al. 1985, J. Phys. Chem. Ref. Data Suppl., 14, 1 [NASA ADS] [CrossRef] [Google Scholar]
- Chiang, E. I., & Goldreich, P. 1997, ApJ, 490, 368 [NASA ADS] [CrossRef] [Google Scholar]
- Compiegne, M., Verstraete, L., Jones, A., et al. 2011, A&A, 525, A14 [NASA ADS] [CrossRef] [EDP Sciences] [Google Scholar]
- Doucet, C., Habart, E., Pantin, E., et al. 2007, A&A, 470, 625 [CrossRef] [EDP Sciences] [Google Scholar]
- Draine, B. T. 2003, ApJ, 598, 1026 [NASA ADS] [CrossRef] [Google Scholar]
- Draine, B. T. 2011, in PAHs and the Universe, ed. C. Joblin, & A. G. G. M. Tielens, EAS Publ. Ser., 46, 29 [Google Scholar]
- Draine, B. T., & Li, A. 2007, ApJ, 657, 810 [NASA ADS] [CrossRef] [Google Scholar]
- Dullemond, C. P., Henning, Th., Visser, R., et al. 2007, A&A, 473, 457 [NASA ADS] [CrossRef] [EDP Sciences] [Google Scholar]
- Dwek, E., & Smith, R. K. 1996, ApJ, 459, 686 [NASA ADS] [CrossRef] [Google Scholar]
- Ercolano, B., & Owen, J. E. 2010, MNRAS, 406, 1553 [NASA ADS] [Google Scholar]
- Fleck, Jr. J. A., & Canfield, E. H. 1984, J. Comput. Phys., 54, 508 [NASA ADS] [CrossRef] [EDP Sciences] [Google Scholar]
- Galliano, F., Madden, S. C., Tielens, A. G. G. M., et al. 2008, ApJ, 679, 310 [NASA ADS] [CrossRef] [Google Scholar]
- Geers, V. C., van Dishoeck, E. F., Visser, R., et al. 2007, A&A, 476, 279 [NASA ADS] [CrossRef] [EDP Sciences] [Google Scholar]
- Gordon, K. D., Misselt, K. A., Witt, A. N., & Clayton, G. C. 2001, ApJ, 551, 269 [NASA ADS] [CrossRef] [Google Scholar]
- Guhathakurta, P., & Draine, B. T. 1989, ApJ, 345, 230 [NASA ADS] [CrossRef] [Google Scholar]
- Habart, E., Natta, A., & Krügel, E. 2004, A&A, 427, 179 [NASA ADS] [CrossRef] [EDP Sciences] [Google Scholar]
- Hayashi, C. 1981, PThPS, 70, 35 [Google Scholar]
- Heymann, F., & Siebenmorgen, R. 2012, ApJ, 751, 27 [NASA ADS] [CrossRef] [Google Scholar]
- Jayawardhana, R., Fisher, R. S., & Hartmann, L. 1998, ApJ, 503, 79 [Google Scholar]
- Juvela, M., & Padoan, P. 2003, A&A, 397, 201 [NASA ADS] [CrossRef] [EDP Sciences] [Google Scholar]
- Keller, L. D., Sloan, G. C., Forrest, W. J., et al. 2008, ApJ, 684, 411 [NASA ADS] [CrossRef] [Google Scholar]
- Krijt, S., & Dominik, C. 2011, A&A, 531, A80 [NASA ADS] [CrossRef] [EDP Sciences] [Google Scholar]
- Krügel, E. 2008, An introduction to the Physics of Interstellar Dust (IoP) [Google Scholar]
- Lagage, P. O., Pel, J. W., Authier, M., et al. 2006, Science, 314, 621 [NASA ADS] [CrossRef] [PubMed] [Google Scholar]
- Lucy, L. B. 1999, A&A, 344, 282 [NASA ADS] [Google Scholar]
- Mathis, J. S., Mezger, P. G., & Panagia, N. 1983, A&A, 128, 212 [NASA ADS] [Google Scholar]
- Mattioda, A. L., Hudgins, D. M., & Allamandola, L. J. 2005, ApJ, 629, 1188 [NASA ADS] [CrossRef] [Google Scholar]
- Mattioda, A. L., Rutter, L., Parkhill, J., et al. 2008, ApJ, 680, 1243 [NASA ADS] [CrossRef] [Google Scholar]
- Min, M., Dullemond, C. P., de Koter, A., et al. 2009, A&A, 497, 155 [NASA ADS] [CrossRef] [EDP Sciences] [Google Scholar]
- Min, M., Dullemond, C. P., Kama, M., & Dominik, C. 2011, Icarus, 212, 416, 497, 155 [NASA ADS] [CrossRef] [Google Scholar]
- Miroshnichenko, A., Ivezic, Z., Vinkovic, D., & Elitzur, M. 1999, ApJ, 520, 115 [Google Scholar]
- Misselt, K. A., Gordon, K. D., Clayton, G. C., & Wolff, M. J. 2001, ApJ, 551, 277 [NASA ADS] [CrossRef] [Google Scholar]
- Omont, A. 1986, A&A 166, 159 [Google Scholar]
- Peeters, E., Hony, S., & Van Kerckhoven, C. 2002, A&A, 390, 1089 [NASA ADS] [CrossRef] [EDP Sciences] [Google Scholar]
- Preibisch, T., Kim, Y.-C., Favata, F., et al. 2006, ApJS, 160, 401 [Google Scholar]
- Robitaille, T. P. 2010, A&A, 520, A70 [NASA ADS] [CrossRef] [EDP Sciences] [Google Scholar]
- Robitaille, T. P. 2011, A&A, 536, A79 [NASA ADS] [CrossRef] [EDP Sciences] [Google Scholar]
- Salama, F., Bakes, E. L. O., Allamandola, L. J., & Tielens, A. G. G. M. 1996, ApJ, 458, 621 [NASA ADS] [CrossRef] [PubMed] [Google Scholar]
- Sellgren, K., Allamandola, L., Bregman, J. D., et al. 1985, ApJ, 299, 416 [NASA ADS] [CrossRef] [Google Scholar]
- Schutte, W. A., Tielens, A. G. G. M., & Allamandola, L. J. 1993, ApJ, 415, 397 [NASA ADS] [CrossRef] [Google Scholar]
- Siebenmorgen, R. 1993, ApJ, 408, 218 [NASA ADS] [CrossRef] [EDP Sciences] [Google Scholar]
- Siebenmorgen, R., & Heymann, F. 2012, A&A, 539, A20 (SH12) [NASA ADS] [CrossRef] [EDP Sciences] [Google Scholar]
- Siebenmorgen, R., & Krügel, E. 1992, A&A, 259, 614 [NASA ADS] [Google Scholar]
- Siebenmorgen, R., & Krügel, E. 2010, A&A, 511, A6 (SK10) [NASA ADS] [CrossRef] [EDP Sciences] [Google Scholar]
- Siebenmorgen, R., Natta, A., Prusti, T., & Krügel, E. 1998, A&A, 339, 134 [NASA ADS] [Google Scholar]
- Siebenmorgen, R., Krügel, E., & Laureijs, R. 2001, A&A, 377, 735 [NASA ADS] [CrossRef] [EDP Sciences] [Google Scholar]
- Schräpler, R., & Henning, Th. 2004, ApJ, 614, 960 [NASA ADS] [CrossRef] [Google Scholar]
- Stelzer, B., Micela, G., Hamaguchi, K., & Schmitt, J. H. M. M. 2006, A&A, 457, 223 [NASA ADS] [CrossRef] [EDP Sciences] [Google Scholar]
- Tielens, A. G. G. M. 2005, The Physics and Chemistry of the Interstellar Medium (Cambridge University Press), Sect. 6.4 [Google Scholar]
- Tielens, A. G. G. M. 2008, ARA&A, 46, 289 [NASA ADS] [CrossRef] [EDP Sciences] [Google Scholar]
- Uchida, K. I., Sellgren, K., Werner, M. W., & Houdashelt, M. L. 2000, ApJ, 530, 871 [Google Scholar]
- van den Ancker, M., The, P. S., & Tjin A Djie, H. R. E. 1997, A&A, 324, L33 [NASA ADS] [Google Scholar]
- Vinkovic, D., Ivezic, Z., Jurkic, T., & Elitzur, M. 2006, ApJ, 636, 348 [NASA ADS] [CrossRef] [Google Scholar]
- Wood, K., Whitney, B. A., Robitaille, T., & Draine, B. T. 2008, ApJ, 688 1118 [Google Scholar]
- Youdin, A. N., & Lithwick, Y. 2007, Icarus, 192, 588 [NASA ADS] [CrossRef] [Google Scholar]
- Zubko, V. G., Mennella, V., Colangeli, L., et al. 1996, MNRAS, 282, 1321 [NASA ADS] [CrossRef] [Google Scholar]
All Tables
PAH band ratios calculated for different stellar radiation fields and cut-off wavelengths of the PAH absorption cross section, λcut.
All Figures
|
Fig. 1 Strength of the CC stretching modes at 6.2 and 7.7 μm relative to the CH out-of-plane bending mode at 11.3 μm. Observed variations (shaded) and mean values (dashed) by Galliano et al. (2008). Full lines at various colors represent band ratios of PAHs with different hydrogenation, α (H/C), and excited by mono-energetic radiation with different hardness (Eγ, as labeled) and constant strength (flux, F). Band ratios derived from PAHs heated by the ISRF are indicated by filled circles and same color index of α. Beside other parameters the degree of ionisation is constant. |
| In the text | |
|
Fig. 2 Influence of stellar temperature and cut-off wavelength of the PAH absorption cross section on the IR emission bands. Spectra are normalized to their far-IR peak. |
| In the text | |
|
Fig. 3 Comparison of the SED of a stellar heated, optically thick (τV = 10) dust sphere of constant density computed with a ray tracing method (Krügel 2008, full line) and the MC code of this work (dashed). The flux ratio between both methods is displayed in gray. |
| In the text | |
|
Fig. 4 Mid IR emission of T Tau disks with X-ray luminosity of LX = 10-4 L∗ (dashed), LX = 10-6 L∗ (dashed), and LX = 0 (full line). SEDs are computed for flaring disks in “1D” (top) and with MC (bottom). |
| In the text | |
|
Fig. 5 IR emission of T Tau disks with and without dust envelope, viewed nearly (~20°) edge-on. Heating includes X-ray luminosities as indicated. |
| In the text | |
|
Fig. 6 IR emission of a Herbig Ae disks with (magenta) and without (black) dust envelope, viewed nearly face-on (top) or edge-on (bottom). Results for different X-luminosities as indicated. |
| In the text | |
|
Fig. 7 Mid-IR images at 11.3 μm of a disk with (middle) and without (right) PAHs heated by a Herbig Ae star and viewed at 30° from the midplane. Images are normalized to the stellar flux. Color bars are in log(Jy/arcsec2). Left: surface brightness distribution of the images measured as cut from the star. |
| In the text | |
Current usage metrics show cumulative count of Article Views (full-text article views including HTML views, PDF and ePub downloads, according to the available data) and Abstracts Views on Vision4Press platform.
Data correspond to usage on the plateform after 2015. The current usage metrics is available 48-96 hours after online publication and is updated daily on week days.
Initial download of the metrics may take a while.