Free Access
Fig. 3
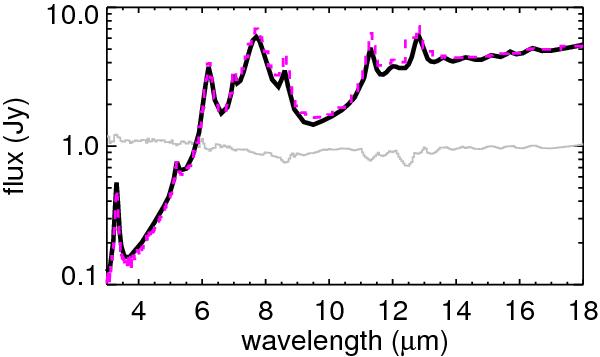
Comparison of the SED of a stellar heated, optically thick (τV = 10) dust sphere of constant density computed with a ray tracing method (Krügel 2008, full line) and the MC code of this work (dashed). The flux ratio between both methods is displayed in gray.
Current usage metrics show cumulative count of Article Views (full-text article views including HTML views, PDF and ePub downloads, according to the available data) and Abstracts Views on Vision4Press platform.
Data correspond to usage on the plateform after 2015. The current usage metrics is available 48-96 hours after online publication and is updated daily on week days.
Initial download of the metrics may take a while.