| Issue |
A&A
Volume 542, June 2012
|
|
|---|---|---|
| Article Number | L34 | |
| Number of page(s) | 4 | |
| Section | Letters | |
| DOI | https://doi.org/10.1051/0004-6361/201219518 | |
| Published online | 13 June 2012 | |
ALMA reveals a chemically evolved submillimeter galaxy at z = 4.76
1 The Hakubi Center for Advanced Research, Kyoto University, Kyoto 606-8302, Japan
e-mail: This email address is being protected from spambots. You need JavaScript enabled to view it.
2 Department of Astronomy, Kyoto University, Kitashirakawa-Oiwake-cho, Sakyo-ku, Kyoto 606-8502, Japan
3 Cavendish Laboratory, Univerisy of Cambridge, 19 J. J. Thomson Ave., Cambridge CB3 0HE, UK
4 European Southern Observatory, Karl Schwarzschild Strasse 2, 85748 Garching, Germany
5 School of Physics and Astronomy, University of Leeds, Leeds LS2 9JT, UK
6 East Asian ALMA Regional Center, National Astronomical Observatory of Japan, Osawa 2-21-1, Mitaka, Tokyo 181-8588, Japan
Received: 2 May 2012
Accepted: 21 May 2012
Abstract
The chemical properties of high-z galaxies provide important information for constraining galaxy evolutionary scenarios. However, widely used metallicity diagnostics based on rest-frame optical emission lines are unusable for heavily dust-enshrouded galaxies (such as submillimeter galaxies; SMGs), especially at z > 3. Here we focus on the flux ratio of the far-infrared fine-structure emission lines [N ii] 205 μm and [C ii] 158 μm to assess the metallicity of high-z SMGs. Through ALMA cycle 0 observations, we have detected the [N ii] 205 μm emission in a strongly [C ii]-emitting SMG, LESS J033229.4–275619 at z = 4.76. The velocity-integrated [N ii]/[C ii] flux ratio is 0.043 ± 0.008. This is the first measurement of the [N ii]/[C ii] flux ratio in high-z galaxies, and the inferred flux ratio is similar to the ratio observed in the nearby universe (~0.02−0.07). The velocity-integrated flux ratio and photoionization models suggest that the metallicity in this SMG is consistent with solar, implying that the chemical evolution has progressed very rapidly in this system at z = 4.76. We also obtain a tight upper limit on the CO(12 − 11) transition, which translates into CO(12−11)/CO(2−1) < 3.8 (3σ). This suggests that the molecular gas clouds in LESS J033229.4–275619 are not significantly affected by the radiation field emitted by the AGN in this system.
Key words: galaxies: high-redshift / galaxies: individual: LESS J033229.4 / 275619 / submillimeter: galaxies / submillimeter: ISM
© ESO, 2012
1. Introduction
Investigating the metal content in galaxies is a powerful diagnostic for testing galaxy evolutionary models, because the metallicity is determined by the past star-formation history, gas inflow, and outflow phenomena. The gas metallicity in galaxies has been investigated in galaxies up to z ~ 3 (Maiolino et al. 2008; Mannucci et al. 2010). However, rest-frame optical metallicity diagnostics (e.g., Nagao et al. 2006a) are not applicable for galaxies at z > 4, where the optical emission lines required to measure the metallicity are redshifted out of the near-infrared atmospheric window (see Maiolino et al. 2008). Moreover, high-z young galaxies with vigorous star formation are often obscured by dust and recognized as, e.g., ultraluminous infrared galaxies (ULIRGs) and submillimeter galaxies (SMGs). In these galaxies, the rest-frame optical lines are significantly affected by the dust extinction and accordingly the optical metallicity diagnostics may lead to large systematic errors. For instance, it has been claimed that ULIRGs show systematically lower metallicities than expected from the mass-metallicity relation (Rupke et al. 2008; Caputi et al. 2008); but this may simply be a consequence of the fact that in these heavily obscured systems the optical metallicity tracers only probe the outer, less enriched regions. Santini et al. (2010) reported that the high dust mass measured in these galaxies disagrees with the metallicity inferred from the optical metallicity diagnostics, suggesting that the optical spectral indices are likely unreliable in these dusty systems.
Metallicity diagnostics exploiting far-infrared fine-structure emission lines are powerful alternatives (Nagao et al. 2011). Here we focus on the two strongest fine-structure lines at λrest > 150 μm, i.e., [C ii] 158 μm and [N ii] 205 μm. The [C ii] 158 μm emission (νrest = 1900.539 GHz) is one of the strongest lines among the whole electromagnetic spectrum and is consequently observed for some high-z objects even up to z ~ 6 − 7 (Maiolino et al. 2005; Walter et al. 2009a; Venemans et al. 2012). This emission arises mainly in H ii regions and photodissociation regions (PDRs), and the relative contribution from those two regions depends on the physical conditions of gas clouds (e.g., Abel et al. 2005). The [N ii] 205 μm emission (νrest = 1461.132 GHz; Brown et al. 1994) arises in H ii regions (see Nagao et al. 2011). In H ii regions, the [N ii]/[C ii] flux ratio depends mostly on the N/C elemental abundance ratio, while it is relatively insensitive to other gas physical conditions such as the gas density, since their critical densities are similar (ncr = 44 cm-3 and 46 cm-3 for [N ii] 205 μm and [C ii] 158 μm at 8000 K, respectively). Note that the N/C ratio is proportional to Zgas at least for log Zgas/Z⊙ > − 0.5 as observed in Galactic H ii regions (e.g., van Zee et al. 1998) because nitrogen is a secondary element (see also Hamann & Ferland 1999). Since the volume ratio of H ii regions and PDRs also depends on cloud properties such as the gas density and ionization structure (hence the ionization parameter), the observed [N ii]/[C ii] flux ratio accordingly depends on those parameters. Recently, [N ii] 205 μm detections have been obtained for three strongly lensed galaxies at z ~ 4−5 (Decarli et al. 2012; Combes et al. 2012); however a [C ii] 158 μm detection has not been reported in any of these galaxies.
Here we show that the [N ii]/[C ii] flux ratio is a good metallicity indicator based on photoionization models, and apply this new method to a high-z luminous SMG, LESS J033229.4 − 275619 (hereafter LESS J0332). We selected this SMG because this object is starburst-dominated and shows intense [C ii] 158 μm emission (De Breuck et al. 2011), making this SMG a good target for the [N ii] 205 μm observation. In this Letter we report a clear [N ii] 205 μm detection based on our ALMA cycle 0 observation, and discuss the chemical property of a high-z SMG. Throughout this Letter, we adopt a cosmology with H0 = 70 km s-1 Mpc-1, Ωm = 0.27, and ΩΛ = 0.73.
2. Observations and results
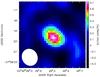 |
Fig. 1 Velocity-integrated [N ii] map of LESS J0332 after the continuum subtraction, with the spatial sampling of 0.2 arcsec/pixel. The velocity range from −558 km s-1 to −154 km s-1 (with respect to the Lyα emission-line peak) is integrated. Contours at 3σ, 4σ, 5σ, 6σ, and 7σ levels are also given in the map. The shape of the synthesized beam is shown at the lower left-hand corner. |
We observed LESS J0332 at z = 4.76, with the band 6 receiver on the Atacama Large Millimeter/submillimeter Array (ALMA) in the dual-polarization setup, as a cycle 0 program. The observation was carried out in three separated runs; on 2011 October 1, 2012 January 12, and 2012 January 13. Each observing run consisted of 1.2 h and the total observing time is 3.6 h, including overheads. The receiver was tuned to 253.96001 GHz to cover the redshifted [N ii] 205 μm emission with the upper sideband, whose redshift is based on our previous [C ii] 158 μm detection (De Breuck et al. 2011). The lower sideband was used to cover the redshifted CO(12−11) emission (νrest = 1381.995 GHz). The correlator was used in the frequency domain mode with a bandwidth of 1875 MHz (488.28 kHz × 3840 channels). The observation was performed with 18 antennas in the compact configuration, but the data obtained with one antenna was flagged out in the last run due to its high system temperature. Callisto was also observed as a flux calibrator. The bandpass and phase were calibrated with J0522–364 and J0403–360, respectively. The atmospheric condition was PWV = 3.0 − 5.0 mm in the first run and PWV = 1.0 − 2.0 mm for the last two runs.
The data were processed with Common Astronomy Software Applications (CASA; McMullin et al. 2007; Petry & the CASA Development Team 2012) in a standard manner. A 70-channel (or equivalently, 40.54 km s-1) binning was applied to the data cube, and then the clean process was applied with the natural weighting, which gives a final synthesized beam size of 1.67′′ × 1.48′′ (position angle = 26.8 degree). The [N ii] 205 μm emission of LESS J0332 is clearly detected in the continuum-subtracted binned channel map, as shown in Fig. 1.
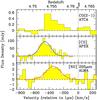 |
Fig. 2 Top panel: ATCA CO(2 − 1) spectrum of LESS J0332 adopting a 90 km s-1 binning (Coppin et al. 2010). Middle panel: APEX [C ii] 158 μm spectrum with a 28 km s-1 binning (De Breuck et al. 2011). Bottom panel: ALMA [N ii] 205 μm spectrum with a 41 km s-1 binning. All the spectrum is continuum-subtracted. The best-fit Gaussian profile is overlaid on the [C ii] and [N ii] spectra. The velocity is relative to the Lyα redshift, and the zero velocity is indicated by the dotted line. |
Figure 2 shows the [N ii] 205 μm spectrum of LESS J0332 adopting an aperture size of 4.8 arcsec2, with the previously reported spectra of CO(2 − 1) (Coppin et al. 2010) and [C ii] 158 μm (De Breuck et al. 2011). The [N ii] 205 μm detection significance is ~8σ. The emission line is fitted with a single Gaussian profile. The best-fit result is parameterized by the peak frequency of 253.868 ± 0.007 GHz, peak intensity of 2.58 ± 0.21 mJy, FWHM of 230 ± 22 km s-1, and the velocity-integrated flux of 630 ± 78 mJy km s-1. The redshift inferred from the observed [N ii] 205 μm frequency is z [NII] = 4.7555 ± 0.0002, which is significantly blueshifted from the Lyα redshift. This blueshift is probably caused by the Lyα absorption by the intergalactic neutral hydrogen. The redshift is consistent with the CO(2 − 1) redshift, though there is a velocity offset, significant at ~ 2σ, between the [N ii] 205 μm and [C ii] 158 μm lines. This velocity offset may be a consequence of the modest signal-to-noise ratio in the two spectra, especially in the [C ii] spectrum. Forthcoming [C ii] ALMA observations of the same objects will either confirm or reconcile the velocity discrepancy. However, if this velocity offset is confirmed, this results in different [N ii]/[C ii] flux ratios in the blue and red components (see Sect. 3.2).
The redshifted CO(12 − 11) emission is not detected in our ALMA data. The inferred 3σ upper limit on the velocity-integrated flux is 344 mJy km s-1 (adopting the same aperture size as adopted for the [N ii] 205 μm line and assuming the same velocity profile).
The continuum emission at λobs ~ 1.2 mm (i.e., λrest ~ 210 μm) is clearly detected with high accuracy. Its flux is 3.5 ± 0.1 mJy with the same aperture as adopted for the [N ii] 205 μm measurement. These measurements were made by combining the upper and lower sideband data and excluding the channels affected by the [N ii] 205 μm emission and by a relatively high noise level at the edges of the sidebands.
Both the [N ii] 205 μm emission and the continuum emission are unresolved at our angular resolution. The two-dimensional Gaussian fit on the velocity-integrated images results in the major and minor axis FWHMs of 1.86 ± 0.44 arcsec and 1.31 ± 0.47 arcsec for the [N ii] 205 μm emission, and 1.72 ± 0.19 arcsec and 1.55 ± 0.21 arcsec for the continuum emission. Both results are consistent with the synthesized-beam image shape.
Observed properties of LESS J033229.4–275619.
3. Discussion
3.1. Possible AGN contribution
Gilli et al. (2011) reported the presence of a Compton-thick active galactic nucleus (AGN) in LESS J0332. If the AGN contributes significantly to the observed far-IR emission lines, its interpretation would become accordingly more complex. Within this context the CO spectral line energy distribution can help, since it is sensitive to the heating energy source. CO lines at high excitation levels are significantly stronger when the molecular gas clouds are affected by the X-ray emission from AGNs than in cases without AGNs (see, e.g., Spaans & Meijerink 2008). The nearby ULIRG-Quasar Mrk 231 shows strong high-J CO lines up to J = 13 − 12, which are properly accounted for by introducing X-ray dominated regions (XDRs) into models (van der Werf et al. 2010). At high-z the gravitationally magnified quasar at z = 3.91, APM 08279+5255 also shows strong high-J CO lines (Weiß et al. 2007; Bradford et al. 2011), which are also well described by XDR models. The CO spectral line energy distribution of other star-formation-dominated high-z galaxies, such as SMM J16359+6612 at z = 2.5 (Weiß et al. 2005) and IRAS F10214+4724 at z = 2.3 (Ao et al. 2008), is completely different from that of APM 08279+5255, showing weaker high-J CO lines (see, e.g., Fig. 14 in Weiß et al. 2007).
By combining our upper limit on the CO(12 − 11) flux and the previous measurement of the CO(2 − 1) flux (Coppin et al. 2010), we obtain a 3σ upper limit on the flux ratio of CO(12 − 11)/CO(2 − 1) of 3.8. This upper limit is inconsistent with the CO spectral line energy distribution of the quasar APM 08279+5255, but is fully consistent with other star-formation-dominated high-z objects (see Fig. 14 in Weiß et al. 2007). This suggests that the molecular clouds in LESS J0332 are not described by XDR models, i.e., the AGN contribution to the heating and excitation of the ISM in LESS J0332 is not significant. This is consistent with our earlier study on LESS J0332 (De Breuck et al. 2011), where we estimated that the XDR contribution to the [C ii] 158 μm is ~1.3%, based on the absorption-corrected X-ray luminosity of L2 − 10 keV = 2.5 × 1044 erg s-1 (Gilli et al. 2011) and a scaling relation of L [CII] ,AGN = 2 × 10⁻³ L2 − 10 keV (Stacey et al. 2010).
3.2. Gas metallicity
Based on our [N ii] 205 μm detection and our previous [C ii] 158 μm detection (De Breuck et al. 2011) in LESS J0332, the velocity-integrated flux ratio of [N ii]/[C ii] is inferred to be 0.043 ± 0.008. Unfortunately, there are only few previous measurements on the [N ii] 205 μm line in galaxies (mostly because this line was not covered by the ISO/LWS wavelength range). In the nearby universe, the flux ratio of [N ii]/[C ii] is reported only for M 82 (~0.050; Petuchowski et al. 1994), Mrk 231 (~0.067; Fischer et al. 2010), NGC 1097 (~0.017; Beirão et al. 2010), and Arp 220 (~0.059; Rangwala et al. 2011). Therefore the [N ii]/[C ii] flux ratio of LESS J0332 is similar to the observed ratios reported for nearby galaxies, suggesting similar Zgas.
At high-z [N ii] 205 μm has been detected in HLS J091828.6+514223 at z = 5.24 (Combes et al. 2012), APM 08279+5255 at z = 3.91, and MM 18423+5938 at z = 3.93 (Decarli et al. 2012). However, their [C ii] 158 μm line has not been observed and consequently their [N ii]/[C ii] ratio is unknown (see Walter et al. 2009b, and references therein). Therefore our [N ii] 205 μm detection allows us to infer the first measurement of the diagnostic [N ii]/[C ii] flux ratio at high-z. Note that there are many [N ii] 122 μm detections in nearby galaxies (e.g., Graciá-Carpio et al. 2011) and also in a few high-z galaxies (Ferkinhoff et al. 2011). Although there are attempts to infer the [N ii] 205 μm flux from the [N ii] 122 μm emission (e.g., Decarli et al. 2012), this method may introduce a large systematic error because the flux ratio of [N ii] 122 μm and [N ii] 205 μm varies by a factor of ~10, i.e., it is strongly dependent on the gas density (see Oberst et al. 2006).
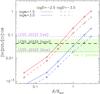 |
Fig. 3 Observed [N ii]/[C ii] flux ratios compared with model predictions. The green hatched range denotes the observed range for low-z galaxies. The horizontal dashed line shows our ALMA result on LESS J0332, where the emission-line fluxes are measured by integrating the best-fit Gaussian function. Dotted magenta lines denote the flux ratio at the red part (from −350 km s-1 to −150 km s-1) and blue part (from −550 km s-1 to −350 km s-1) of the lines. The red and blue lines show Cloudy model results as a function of Zgas with log nHII = 1.5 and 3.0 respectively, while solid and dashed lines denote the models with log UHII = −2.5 and − 3.5, respectively. |
To explore the gas metallicity in LESS J0332 more quantitatively, we carried out model calculations using Cloudy (Ferland et al. 1998) version 08.00. Since the [C ii] line arises in both H ii regions and PDRs, a consistent treatment to connect those two regions is required to investigate the [N ii]/[C ii] flux ratio. We assumed a pressure-equilibrium gas cloud that is characterized by certain gas densities and ionization parameters at the illuminated face (nHII and UHII) for each model run. Here we examine gas clouds with log nHII = 1.5 and 3.0, and log UHII = −3.5 and −2.5, for Zgas/Z⊙ = 0.05 − 3.0. Note that the gas density in PDRs is higher than log nHII under the pressure-equilibrium assumption. The input continua are the starburst99 constant star-formation model spectra (Leitherer et al. 1999) with an age of 1 Myr and a stellar metallicity equal to the gas metallicity. We did not take AGN effects into account in the models since the expected AGN contribution is small (see Sect. 3.1). The relative chemical composition of gas clouds is scaled from the solar elemental abundance ratios except for nitrogen, which scales as  at Zgas > 0.23 Z⊙ (see Kewley & Dopita 2002). Orion-type graphite and silicate grains are included. Calculations are stopped at the depth of AV = 100 mag to cover the whole [C ii] 158 μm emitting regions, following Abel et al. (2005). Note that the resulting [N ii]/[C ii] flux ratios are not sensitive to the adopted stopping criterion. The calculation details are given in Nagao et al. (2011).
The [N ii]/[C ii] flux ratio predicted by the model runs are compared with observations in Fig. 3. The models show that the [N ii]/[C ii] flux ratio increases monotonically with Zgas. The moderate dependences on parameters other than Zgas, such as nHII and UHII, prevent us from determining the accurate Zgas value. The observed [N ii]/[C ii] flux ratio (~0.043) infers log (Zgas/Z⊙) ~ 0.0 ± 0.3; i.e., consistent to the solar metallicity. Although the constraint on the gas metallicity is currently fairly loose, by observing additional lines in the future (such as [N ii] 122 μm and [O i] 145 μm) it will be possible to constrain the gas properties (density and ionization parameter) and therefore determine the gas metallicity much more accurately.
However, we note that the velocity profiles of the [N ii] 205 μm and [C ii] 158 μm emission are different (Fig. 2). In the redder part of the line the [N ii]/[C ii] flux ratio is significantly lower than that in the bluer part. If the different [N ii]/[C ii] ratios for different velocities are caused by metallicity variations, this implies that the system is not chemically homogeneous, but probably resulting from a merging systems where gas with different metallicities has not fully mixed yet. More specifically, the redder component with a high [N ii]/[C ii] flux ratio may be associated with a chemically enriched galaxy that is merging with a metal poor galaxy, associated with the bluer component characterized by the low [N ii]/[C ii] ratio. To investigate this scenario more quantitatively, we measured the [N ii]/[C ii] flux ratio on the redder part (−350 km s-1 < V < −150 km s-1) and on the bluer part (−550 km s-1 < V < −350 km s-1) of the lines, resulting in a flux ratio of 0.086 and 0.020, respectively. These values roughly correspond to the highest and lowest flux ratios seen in nearby galaxies (Fig. 3), which is indicative of solar-supersolar metallicity in the former case and sub-solar metallicity in the later case. Note that the two distinct [N ii] 205 μm velocity components are seen in another high-z [N ii] 205 μm emitter, HLS J091828.6+514223 (Combes et al. 2012), which may be another example of a chemically inhomogeneous system at high-z.
The low-metallicity component in LESS J0332 was already identified in our previous work on this SMG, where we argued (based at that time solely on the [C ii] 158 μm, FIR and CO properties) that the gas metallicity in LESS J0332 is low (De Breuck et al. 2011). However, the most interesting result obtained here is that this system does also host a significant metal-rich component (with solar-supersolar metallicity), indicating that this system is chemically highly evolved already at z = 4.76 (the cosmic age of 1.27 Gyr).
This result is consistent with past metallicity studies on high-z AGNs. The diagnostic flux ratios of some UV metallic permitted lines of type-1 quasars show no redshift evolution of the quasar broad-line region up to z ~ 6 (e.g., Nagao et al. 2006c; Juarez et al. 2009). The metallicity in narrow-line regions of type-2 AGNs (which trace larger spatial scales and are therefore more closely related to the host galaxy properties than to the broad-line region) also show no redshift evolution (e.g., Nagao et al. 2006b) even up to z ~ 5.2 (Matsuoka et al. 2011). Note that the high-z AGNs investigated in those studies are hosted mostly by massive galaxies (see, e.g., Seymour et al. 2007), similar to SMGs (e.g., Borys et al. 2005). These results on the metallicity of AGNs and LESS J0332 suggest that the chemical evolution of massive systems has progressed very rapidly in the early epoch, z > 5, which is qualitatively consistent with the so-called downsizing evolution seen in galaxies and AGNs (e.g., De Lucia et al. 2006; Ikeda et al. 2011).
Acknowledgments
This paper makes use of the following cycle 0 ALMA data: ADS/JAO.ALMA#2011.0.00268.S (PI: T. Nagao). ALMA is a partnership of NINS (Japan), ESO (representing its member states), and NSF (USA), together with NRC (Canada) and NSC and ASIAA (Taiwan), in cooperation with the Republic of Chile. The Joint ALMA Observatory is operated by NAOJ, ESO, and AUI/NRAO. We thank the ALMA staff for their supports, and Fabian Walter and the anonymous referee for useful comments. Cloudy was developed and publicly released by G. Ferland and his collaborators. T.N. is financially supported by JSPS (grant No. 23654068). B.H. is a JSPS fellow.
References
- Abel, N. P., Ferland, G. J., Shaw, G., & van Hoof, P. A. M. 2005, ApJS, 161, 65 [NASA ADS] [CrossRef] [Google Scholar]
- Ao, Y., Weiß, A., Downes, D., et al. 2008, A&A, 491, 747 [NASA ADS] [CrossRef] [EDP Sciences] [Google Scholar]
- Beirão, P., Armus, L., Appleton, P. N., et al. 2010, A&A, 518, L60 [NASA ADS] [CrossRef] [EDP Sciences] [Google Scholar]
- Borys, C., Smail, I., Chapman, S. C., et al. 2005, ApJ, 635, 853 [NASA ADS] [CrossRef] [Google Scholar]
- Bradford, C. M., Bolatto, A. D., Maloney, P. R., et al. 2011, ApJ, 741, L37 [NASA ADS] [CrossRef] [Google Scholar]
- Brown, J. M., Varberg, T. D., Evenson, K. M., et al. 1994, ApJ, 428, L37 [NASA ADS] [CrossRef] [Google Scholar]
- Caputi, K. I., Lilly, S. J., Aussel, H., et al. 2008, ApJ, 680, 939 [NASA ADS] [CrossRef] [Google Scholar]
- Combes, F., Rex, M., Rawle, T. D., et al. 2012, A&A, 538, L4 [NASA ADS] [CrossRef] [EDP Sciences] [Google Scholar]
- Coppin, K. E. K., Smail, I., Alexander, D. M., et al. 2009, MNRAS, 395, 1905 [NASA ADS] [CrossRef] [Google Scholar]
- Coppin, K. E. K., Chapman, S. C., Smail, I., et al. 2010, MNRAS, 407, L103 [NASA ADS] [CrossRef] [Google Scholar]
- De Breuck, C., Maiolino, R., Caselli, P., et al. 2011, A&A, 530, L8 [NASA ADS] [CrossRef] [EDP Sciences] [Google Scholar]
- De Lucia, G., Springel, V., White, S. D. M., et al. 2006, MNRAS, 366, 499 [NASA ADS] [CrossRef] [Google Scholar]
- Decarli, R., Walter, F., Neri, R., et al. 2012, ApJ, 752, 2 [NASA ADS] [CrossRef] [Google Scholar]
- Ferkinhoff, C., Brisbin, D., Nikola, T., et al. 2011, ApJ, 740, L29 [NASA ADS] [CrossRef] [Google Scholar]
- Ferland, G. J., Korista, K. T., Verner, D. A., et al. 1998, PASP, 110, 761 [Google Scholar]
- Fischer, J., Sturm, E., González-Alfonso, E., et al. 2010, A&A, 518, L41 [NASA ADS] [CrossRef] [EDP Sciences] [Google Scholar]
- Gilli, R., Su, J., Norman, C., et al. 2011, ApJ, 730, L28 [NASA ADS] [CrossRef] [Google Scholar]
- Graciá-Carpio, J., Sturm, E., Hailey-Dunsheath, S., et al. 2011, ApJ, 728, L7 [NASA ADS] [CrossRef] [Google Scholar]
- Hamann, F., & Ferland, G. 1999, ARA&A, 37, 487 [NASA ADS] [CrossRef] [Google Scholar]
- Ikeda, H., Nagao, T., Matsuoka, K., et al. 2011, ApJ, 728, L25 [NASA ADS] [CrossRef] [Google Scholar]
- Juarez, Y., Maiolino, R., Mujica, R., et al. 2009, A&A, 494, L25 [NASA ADS] [CrossRef] [EDP Sciences] [Google Scholar]
- Kewley, L. J., & Dopita, M. A. 2002, ApJS, 142, 35 [NASA ADS] [CrossRef] [Google Scholar]
- Leitherer, C., Schaerer, D., Goldader, J. D., et al. 1999, ApJS, 123, 3 [NASA ADS] [CrossRef] [Google Scholar]
- Maiolino, R., Cox, P., Caselli, P., et al. 2005, A&A, 440, L51 [NASA ADS] [CrossRef] [EDP Sciences] [Google Scholar]
- Maiolino, R., Nagao, T., Grazian, A., et al. 2008, A&A, 488, 463 [NASA ADS] [CrossRef] [EDP Sciences] [Google Scholar]
- Mannucci, F., Cresci, G., Maiolino, R., et al. 2010, MNRAS, 408, 2115 [NASA ADS] [CrossRef] [Google Scholar]
- Matsuoka, K., Nagao, T., Maiolino, R., et al. 2011, A&A, 532, L10 [NASA ADS] [CrossRef] [EDP Sciences] [Google Scholar]
- McMullin, J. P., Waters, B., Schiebel, D., Young, W., & Golap, K. 2007, in ADASS XVI, ed. R. A. Shaw et al., ASP Conf. Ser., 376, 127 [Google Scholar]
- Nagao, T., Maiolino, R., & Marconi, A. 2006a, A&A, 459, 85 [NASA ADS] [CrossRef] [EDP Sciences] [Google Scholar]
- Nagao, T., Maiolino, R., & Marconi, A. 2006b, A&A, 447, 863 [NASA ADS] [CrossRef] [EDP Sciences] [Google Scholar]
- Nagao, T., Marconi, A., & Maiolino, R. 2006c, A&A, 447, 157 [NASA ADS] [CrossRef] [EDP Sciences] [Google Scholar]
- Nagao, T., Maiolino, R., Marconi, A., & Matsuhara, H. 2011, A&A, 526, A149 [NASA ADS] [CrossRef] [EDP Sciences] [Google Scholar]
- Oberst, T. E., Parshley, S. C., Stacey, G. J., et al. 2006, ApJ, 652, L125 [NASA ADS] [CrossRef] [MathSciNet] [Google Scholar]
- Petry, D., & the CASA Development Team 2012 [arXiv:1201.3454] [Google Scholar]
- Petuchowski, S. J., Bennett, C. L., Haas, M. R., et al. 1994, ApJ, 427, L17 [NASA ADS] [CrossRef] [Google Scholar]
- Rangwala, N., Maloney, P. R., Glenn, J., et al. 2011, ApJ, 743, 94 [NASA ADS] [CrossRef] [Google Scholar]
- Rupke, D. S. N., Veilleux, S., & Baker, A. J. 2008, ApJ, 674, 172 [NASA ADS] [CrossRef] [Google Scholar]
- Santini, P., Maiolino, R., Magnelli, B., et al. 2010, A&A, 518, L154 [NASA ADS] [CrossRef] [EDP Sciences] [Google Scholar]
- Seymour, N., Stern, D., De Breuck, C., et al. 2007, ApJS, 171, 353 [NASA ADS] [CrossRef] [Google Scholar]
- Spaans, M., & Meijerink, R. 2008, ApJ, 678, L5 [NASA ADS] [CrossRef] [Google Scholar]
- Stacey, G. J., Hailey-Dunsheath, S., Ferkinhoff, C., et al. 2010, ApJ, 724, 957 [NASA ADS] [CrossRef] [Google Scholar]
- van der Werf, P. P., Isaak, K. G., Meijerink, R., et al. 2010, A&A, 518, L42 [NASA ADS] [CrossRef] [EDP Sciences] [Google Scholar]
- van Zee, L., Salzer, J. J., & Haynes, M. P. 1998, ApJ, 497, L1 [NASA ADS] [CrossRef] [Google Scholar]
- Venemans, B. P., McMahon, R. G., Walter, F., et al. 2012, ApJ, 751, L25 [Google Scholar]
- Walter, F., Riechers, D., Cox, P., et al. 2009a, Nature, 457, 699 [NASA ADS] [CrossRef] [PubMed] [Google Scholar]
- Walter, F., Weiß, A., Riechers, D. A., et al. 2009b, ApJ, 691, L1 [NASA ADS] [CrossRef] [Google Scholar]
- Weiß, A., Downes, D., Walter, F., & Henkel, C. 2005, A&A, 440, L45 [NASA ADS] [CrossRef] [EDP Sciences] [Google Scholar]
- Weiß, A., Downes, D., Neri, R., et al. 2007, A&A, 467, 955 [NASA ADS] [CrossRef] [EDP Sciences] [Google Scholar]
All Tables
All Figures
|
Fig. 1 Velocity-integrated [N ii] map of LESS J0332 after the continuum subtraction, with the spatial sampling of 0.2 arcsec/pixel. The velocity range from −558 km s-1 to −154 km s-1 (with respect to the Lyα emission-line peak) is integrated. Contours at 3σ, 4σ, 5σ, 6σ, and 7σ levels are also given in the map. The shape of the synthesized beam is shown at the lower left-hand corner. |
| In the text | |
|
Fig. 2 Top panel: ATCA CO(2 − 1) spectrum of LESS J0332 adopting a 90 km s-1 binning (Coppin et al. 2010). Middle panel: APEX [C ii] 158 μm spectrum with a 28 km s-1 binning (De Breuck et al. 2011). Bottom panel: ALMA [N ii] 205 μm spectrum with a 41 km s-1 binning. All the spectrum is continuum-subtracted. The best-fit Gaussian profile is overlaid on the [C ii] and [N ii] spectra. The velocity is relative to the Lyα redshift, and the zero velocity is indicated by the dotted line. |
| In the text | |
|
Fig. 3 Observed [N ii]/[C ii] flux ratios compared with model predictions. The green hatched range denotes the observed range for low-z galaxies. The horizontal dashed line shows our ALMA result on LESS J0332, where the emission-line fluxes are measured by integrating the best-fit Gaussian function. Dotted magenta lines denote the flux ratio at the red part (from −350 km s-1 to −150 km s-1) and blue part (from −550 km s-1 to −350 km s-1) of the lines. The red and blue lines show Cloudy model results as a function of Zgas with log nHII = 1.5 and 3.0 respectively, while solid and dashed lines denote the models with log UHII = −2.5 and − 3.5, respectively. |
| In the text | |
Current usage metrics show cumulative count of Article Views (full-text article views including HTML views, PDF and ePub downloads, according to the available data) and Abstracts Views on Vision4Press platform.
Data correspond to usage on the plateform after 2015. The current usage metrics is available 48-96 hours after online publication and is updated daily on week days.
Initial download of the metrics may take a while.