Fig. 3
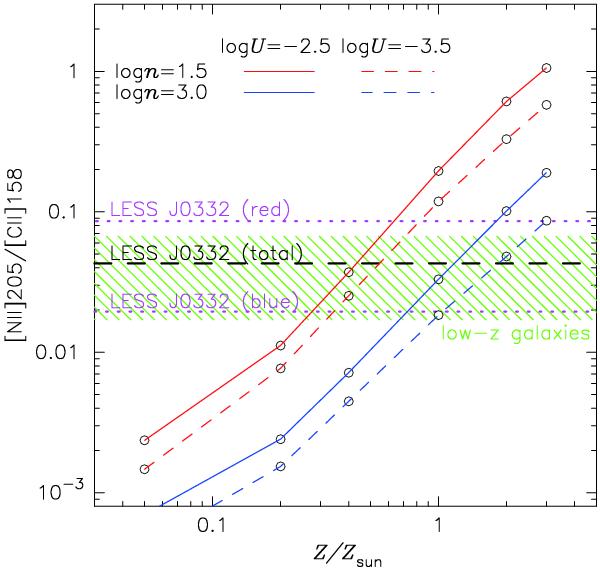
Observed [N ii]/[C ii] flux ratios compared with model predictions. The green hatched range denotes the observed range for low-z galaxies. The horizontal dashed line shows our ALMA result on LESS J0332, where the emission-line fluxes are measured by integrating the best-fit Gaussian function. Dotted magenta lines denote the flux ratio at the red part (from −350 km s-1 to −150 km s-1) and blue part (from −550 km s-1 to −350 km s-1) of the lines. The red and blue lines show Cloudy model results as a function of Zgas with log nHII = 1.5 and 3.0 respectively, while solid and dashed lines denote the models with log UHII = −2.5 and − 3.5, respectively.
Current usage metrics show cumulative count of Article Views (full-text article views including HTML views, PDF and ePub downloads, according to the available data) and Abstracts Views on Vision4Press platform.
Data correspond to usage on the plateform after 2015. The current usage metrics is available 48-96 hours after online publication and is updated daily on week days.
Initial download of the metrics may take a while.