Fig. 1
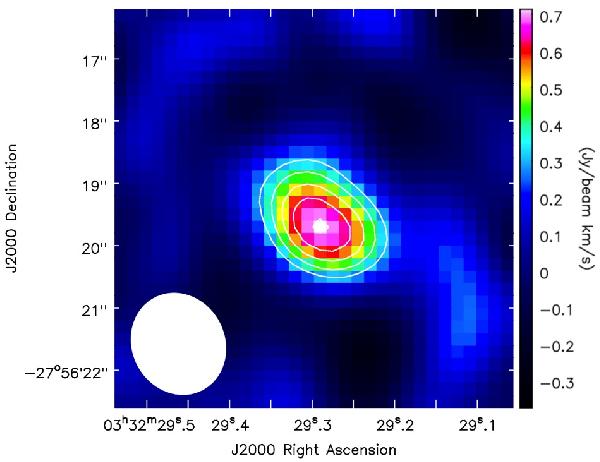
Velocity-integrated [N ii] map of LESS J0332 after the continuum subtraction, with the spatial sampling of 0.2 arcsec/pixel. The velocity range from −558 km s-1 to −154 km s-1 (with respect to the Lyα emission-line peak) is integrated. Contours at 3σ, 4σ, 5σ, 6σ, and 7σ levels are also given in the map. The shape of the synthesized beam is shown at the lower left-hand corner.
Current usage metrics show cumulative count of Article Views (full-text article views including HTML views, PDF and ePub downloads, according to the available data) and Abstracts Views on Vision4Press platform.
Data correspond to usage on the plateform after 2015. The current usage metrics is available 48-96 hours after online publication and is updated daily on week days.
Initial download of the metrics may take a while.