| Issue |
A&A
Volume 542, June 2012
|
|
|---|---|---|
| Article Number | A31 | |
| Number of page(s) | 16 | |
| Section | Stellar atmospheres | |
| DOI | https://doi.org/10.1051/0004-6361/201218968 | |
| Published online | 30 May 2012 | |
Line identification in high-resolution, near-infrared CRIRES spectra of chemically peculiar and Herbig Ae stars⋆,⋆⋆
1 Leibniz-Institut für Astrophysik Potsdam (AIP), An der Sternwarte 16, 14482 Potsdam, Germany
e-mail: This email address is being protected from spambots. You need JavaScript enabled to view it.
2 Istituto Nazionale di Astrofisica, Osservatorio Astronomico di Trieste, via Tiepolo 11, 34143 Trieste, Italy
3 Instituto de Ciencias Astronomicas, de la Tierra, y del Espacio (ICATE), 5400 San Juan, Argentina
4 Jeremiah Horrocks Institute, University of Central Lancashire, Preston PR1 2HE, UK
5 European Southern Observatory, Casilla 19001, Santiago, Chile
6 Department of Astronomy, University of Michigan, Ann Arbor, MI 48109-1042, USA
7 European Southern Observatory, Karl-Schwarzschild-Str. 2, 85748 Garching bei München, Germany
Received: 6 February 2012
Accepted: 22 March 2012
Abstract
Context. Contrary to the late-type stars, our knowledge of atomic transitions in intermediate-mass stars is still very poor. The recent availability of ESO’s high-resolution spectrograph CRIRES offers now the opportunity to study numerous spectral features in the near-IR in intermediate-mass main-sequence and pre-main-sequence stars.
Aims. The aim of the study is to explore the diagnostic potential of near-IR spectral regions. We carry out the first line identification in a few spectral regions for the two strongly magnetic Ap stars γ Equ and HD 154708, and their potential precursors two pre-main sequence Herbig Ae/Be stars HD 101412 and 51 Oph.
Methods. High-resolution CRIRES spectra were obtained in three spectral regions, two regions around 1 μm and one region around 1.57 μm containing magnetically sensitive Fe i lines. To study the spectral line variability in the Herbig Ae star HD 101412, the observations were collected on six different rotation phases. All currently available atomic line lists were involved to properly identify the detected spectral features.
Results. The largest number of near-IR spectral features was detected and identified in the well-studied magnetic Ap star γ Equ. Nearly 30% of the spectral lines in the Ap star HD 154708 with one of the strongest magnetic fields known among the Ap stars of the order of 25 kG, remain unidentified due to a lack of atomic data. Only very few lines belonging to the rare earth element group have been identified in both Ap stars. A number of spectral lines including the Ce iii and Dy ii lines appear magnetically split due to the presence of a strong magnetic field in their atmospheres. The content of the spectra of the Herbig Ae/Be stars HD 101412 and 51 Oph is rather unexciting. Variable behaviour of lines of the elements He, N, Mg, Si, and Fe over the rotation period in the spectra of HD 101412 confirm our previous finding of variability in the optical region. Due to the very fast rotation of 51 Oph, only a few spectral lines have been identified with certainty.
Key words: atomic data / stars: atmospheres / stars: chemically peculiar / stars: magnetic field / stars: pre-main sequence
Based on observations obtained at the European Southern Observatory (ESO programme 087.C-0124(A)).
Appendix A is available in electronic form at http://www.aanda.org
© ESO, 2012
1. Introduction
Owing to the extreme richness of UV and optical spectra, the upper main-sequence chemically peculiar (CP) stars have been intensively studied at the highest possible spectral resolution over the last decades. Among the different groups of CP stars, especially classical Ap stars with strong magnetic fields of ~kG order and exhibiting strong overabundances of iron-peak and rare earth elements are of particular interest. These stars present a natural laboratory to study the element enrichment of stellar atmospheres due to the operation of various competing physical effects (such as, e.g., microscopic diffusion of trace atomic species) in the presence of strong magnetic fields. Due to their generally slow rotation it is also possible to study the isotopic and hyperfine structure of certain elements and their interaction with the magnetic field.
The progenitors of main-sequence stars of intermediate mass are pre-main sequence Herbig Ae/Be stars. Recent spectropolarimetric observations of a few Herbig Ae/Be stars indicate that magnetic fields are important ingredients of the intermediate-mass star formation process. As an example, the sharp-lined young Herbig Ae star HD 101412 with a strong surface magnetic field of the order of a few kG has become over the past few years one of the most studied targets among the Herbig Ae/Be stars using optical and polarimetric spectra.
The recent availability of ESO’s high-resolution CRyogenic Infra-Red Echelle Spectrograph (CRIRES) installed at the ANTU telescope on Cerro Paranal offers now the opportunity to acquire much better knowledge of spectral features in intermediate-mass stars in the near-IR. A study of atomic transitions in this wavelength region for classical magnetic Ap stars is of great interest as the Zeeman splitting of spectral lines in the presence of a magnetic field is proportional to λ2. Knowledge of magnetically sensitive atomic transitions in the spectra of intermediate-mass stars will allow one to achieve the detection of weaker stellar magnetic fields in future studies than is feasible in the optical wavelength region.
Regarding the Herbig Ae/Be stars, a study of their chemical anomalies and a search for the presence of exotic elements in their atmospheres is important to understand the origin of chemically peculiar Ap/Bp stars (e.g., Hubrig et al. 2000; 2007; 2009a). Most near-IR studies of Herbig Ae/Be stars were devoted to molecular spectroscopy to probe the conditions and physical processes in protoplanetary disks. Among the known magnetic Herbig Ae/Be stars, the slow rotation and strong magnetic field of the Herbig Ae star HD 101412 make this star a prime candidate for a line identification study in the near-IR.
The aim of the present study is to explore the diagnostic potential of a few near-IR spectral regions in A and B-type stars. We carried out in a few wavelength regions the first line identification for two strongly magnetic Ap stars, γ Equ and HD 154708, and the magnetic Herbig Ae/Be star HD 101412. In addition, we present CRIRES observations of one of the fastest rotating Herbig Be stars (51 Oph) and discuss the diagnostic potential of CRIRES observations for rapidly rotating stars.
2. Observations
The observations were obtained in service mode between April and June 2011 with the near-infrared (NIR) spectrograph CRIRES using a slit width of 0.2′′. Observations followed an AB on-slit nodding scheme, collecting two to eight spectra with individual exposure times of 10 to 300 s, depending on the brightness of the individual target. Routines of the ESO CRIRES pipeline software have been used for data reduction. Raw observations are flat-fielded, corrected for non-linear detector response, and for bad pixels before frames from different nodding positions are shifted and combined. This procedure results in a small degradation of the spectral resolution because of optical distortions of the instrument along the slit. Therefore, we reach a resolution of 94 600 (instead of the nominal 100 000), which was determined from weak telluric lines. From the combined images, spectra are extracted using an optimum extraction algorithm. Wavelength calibration is determined from daytime ThAr arc lamp exposures.
Logbook of CRIRES observations.
The selected wavelength regions contain the region around the He i 1083.0 nm line (region 1065.5–1091.4 nm), the region around the Paγ line (1084.3–1108.5 nm), and the region with strongly magnetically sensitive Fe i lines (1550.2–1586.6 nm). CRIRES makes use of four Aladdin detectors located in the focal plane of the spectrograph. The detectors 1 and 4 are less useful due to contamination by the adjacent orders. This contamination is worse at shorter wavelengths. As a result, the wavelength calibration on these detectors in the spectral region around 1 μm is not reliable and makes the identification work difficult.
Table 1 summarizes information on the observed targets, including the observed wavelength regions and signal-to-noise ratios for the best detectors 2 and 3. The phases for HD 101412 were calculated according to the ephemerides presented in the work of Hubrig et al. (2011) using magnetic and photometric data:  (1)For HD 154708 the phase at the observational epoch with CRIRES was calculated according to the ephemerides presented in the work of Hubrig et al. (2009b) using magnetic data:
  (2)Telluric features were removed in a few wavelength regions in the spectra of the Herbig Ae/Be star HD 101412 to search for magnetic splitting in a few Fe i lines and to study the spectral variability of line profiles belonging to different elements. After each science observation, a hot rapidly rotating standard star has been observed at a comparable zenith distance. After moving the wavelength scale to the topocentric frame of rest, we averaged the normalized spectra of several standard stars to calculate a master spectrum of the telluric lines. In order to match the telluric line intensity of each object spectrum, this master telluric spectrum was scaled by increasing it to an appropriate power. Then, each object spectrum was divided by its telluric spectrum to obtain a spectrum essentially free of telluric lines. In this way, the corrected object spectrum Scorr was calculated from the observed spectrum Sobs and the telluric line master spectrum T as:
 where α is the ratio of optical thickness of the terrestrial atmosphere in the spectra Sobs and T, respectively. The coefficient α was chosen to obtain a flat spectrum in the regions without stellar lines. Example for the removal of telluric lines in two spectral regions is presented in Fig. 1.
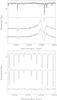 |
Fig. 1 Example for the removal of telluric lines in two spectral regions. Upper panel, from top to bottom: spectra of four standard stars, scaled telluric spectrum, object (=HD 101 412) spectrum, and cleaned object spectrum. Lower panel, from top to bottom: object (=HD 101412) spectrum, telluric line master spectrum (calculated by averaging seven standard star spectra), object spectrum after removing the telluric lines. |
3. The line identification
The stellar lines were identified using the method of spectrum synthesis. For each star, we computed an ATLAS9 model with parameters taken from previous studies carried out by various authors: we adopted Teff = 7700 K, log g = 4.2 for γ Equ (Ryabchikova et al. 1997), Teff = 6800 K, log g = 4.11 for HD 154708 (Nesvacil et al. 2008), Teff = 8300 K, log g = 3.8 for HD 101412 (Cowley et al. 2010), and Teff = 10 250 K, log g = 3.6 for 51 Oph (Montesinos et al. 2009), where g is in cgs units.
The models were used to compute synthetic spectra with the synthe code (Kurucz 1993). We adopted the atomic line lists taken from Kurucz’s web site (http://kurucz.harvard.edu/), but we substituted the log gf values with those from the NIST database, whenever they were available. In addition, in some cases, we replaced the Kurucz log gf values for Si i by those from Meléndez & Barbuy (1999). We added a few lines of Ce iii with wavelengths and log gf values computed by Biémont (priv. comm.), and a Dy ii line at 10835.94 Å taken from the VALD database (Kupka et al. 1999; Heiter et al. 2008). The line broadening parameters are those computed by Kurucz; they are available for most of the identified lines, except for the Sr ii, Ce iii, and Dy ii lines. where they were computed using classical approximations.
We started assuming solar abundances for all the elements. The synthetic spectra were broadened for an instrumental resolving power of 95 000 and for rotational velocities, which were determined from the comparison of a few observed and computed profiles. We found a v sin i of 16 km s-1 for γ Equ, 6 km s-1 for HD 154708, 9 km s-1 for HD 101412, and 100 km s-1 for 51 Oph. These values are rather uncertain, owing to the magnetic fields that affect the line profile widths and that were neglected in the computations.
For identification purposes, the abundances were modified until agreement between the selected observed and computed profiles was achieved. The abundances we obtained from the CRIRES spectra are only rough estimates because, on one side, no Zeeman effect was considered in the line profile computations, and, on the other side, the spectra are affected by telluric lines, by several artifacts, by a wavelength calibration not fully correct. Furthermore, the spectra include entirely two hydrogen lines, at 1093.8086 nm and 1555.6467 nm, and partially three other hydrogen lines: the extreme red wing of 1543.8938 nm, the red wing of 1570.068 nm, and the blue wing of 1588.0558 nm. Owing to the breadth of the hydrogen lines and the rather short (~5 nm) spectral regions covered by each of CRIRES detectors it is very difficult to state were the continuum level has to be placed almost everywhere in the observed spectra. However, in general, the element abundances derived from CRIRES show a satisfactory agreement with the results of abundance determinations presented in previous studies using optical wavelengths. Table 2 lists the abundances adopted for computing the synthetic spectra. For γ Equ, HD 154708, and HD 101412 they are compared with the results from optical regions published by Ryabchikova et al. (1997), Nesvacil et al. (2008), and Cowley et al. (2010), respectively.
The lists of identified lines including observed and laboratory wavelengths, central line depths, oscillator strengths, excitation potentials for the lower and upper levels of the respective transition, and sources for the atomic data are presented in Tables A.1–A.3. We note that several spectral lines remain unidentified due to unavailability of atomic data. The identification list is most complete for the Ap star γ Equ and the Herbig Ae star HD 101412. The results of the line identification for each target are discussed below in Sect. 4.
The observed and synthetic spectra are presented on Castelli’s web page1 together with the line-by-line identification for each studied star.
4. Individual targets
4.1. γ Equ
The classical Ap star γ Equ is one of the best studied Ap stars for which the presence of a magnetic field was discovered several decades ago (Babcock 1958). Due to its brightness, slow rotation, and the presence of a rather strong surface magnetic field of the order of 4 kG this star is frequently used as a standard star in spectropolarimetric observations. Broad-band oscillations with a period of 12.4 min were discovered by Kurtz (1983) and radial velocity oscillations were first studied by Libbrecht (1988). γ Equ belongs to the group of rapidly oscillating Ap (roAp) stars, which are main-sequence stars that pulsate in high radial overtone p modes with periods in the range of 5.7–21 min. RoAp stars show broad-band photometric amplitudes less than 0.01 mag, whereas rapid radial velocity variations in rare earth element lines can reach 8 km s-1 (e.g. Kurtz 1990; Freyhammer et al. 2009).
Among the studied targets, the list of identified lines is the longest and most complete for γ Equ. The definitely identified lines include H i, C i, Si i, Ca i, Mg i, Mg ii, Cr i, Fe i, Ni i, Sr ii, and two lines belonging to the rare-earth element group, Ce iii 1584.76 nm and Dy ii 1083.59 nm. An additional Ce iii line at 1571.5837 nm could be present in the wing of a telluric line. The presence of titanium is doubtful, because we possibly identified two Ti ii lines at 1073.374 nm and 1077.1294 nm, but no Ti i lines. All identified lines in the spectra of this target are presented in Table A.1.
For the H i lines at 1093.8086 nm and 1555.6467 nm, the core and both wings are contained in the observed range. For the line at 1570.068 nm we see the red wing, for that at 1588.0558 nm we see the blue wing.
The only element for which the abundance can be rather well established is Mg i. The solar abundance was determined from the line at 1081.11 nm. It well reproduces other identified Mg i lines, except for those lying on the red wing of H i 1093.8 nm. The only well observed Mg ii line at 1095.1778 nm is poorly reproduced. We note that the Mg i line at 1081.11 nm is subject to full Paschen-Back effect. A more complete discussion of this line is presented in the next subsection.
Most of the Fe i lines in the 1550.0–1585.0 nm interval are split in three components by the magnetic field, so that they were not used for abundance purposes as they cannot be properly dealt with using the SYNTHE code. The iron abundance of − 4.35 dex was derived from the blend Fe i, Fe ii at 1087.16 nm and from the unsplit (or weakly split) Fe i lines at 1576.942 nm and 1577.407 nm.
When we analyzed the Si i lines, we derived two different Si i abundances. A first group of lines was rather well reproduced by − 3.9 dex, as derived from Si i at 1074.9378 nm, a second group of lines was well reproduced by − 4.35 dex, as derived from the line at 1088.533 nm. The source for the log gf values was NIST4 for most lines of the first group and Kurucz (2007)2 for most lines of the second group. The disagreement disappeared after the Kurucz (2007) log gf values were replaced by Meléndez & Barbuy (1999) log gf data, as suggested by the referee. In this way, the whole Si i observed spectrum is rather well synthetized by the sole abundance of − 3.9 dex. The line Si i at 1555.778 nm is split into two components due to the presence of the magnetic field.
All other elements are present with very few lines, usually weak, so that their abundance was derived either from the only observed line (Al i at 1089.172 nm, Ni i at 1555.537 nm, Sr ii at 1091.4887 nm) or from that of the lines which we estimated as the best suited to give the abundance (C i at 1072.955 nm, Ca i at 1083.897 nm, Cr i at 1090.586 nm, Ce iii at 1584.755 nm). The abundances in these cases are very uncertain, as the Zeeman effect was not considered in the line profile computations. In fact, when other lines are present, they would have required somewhat different abundances. A second Ce iii line at 1571.5837 nm could be present in the wing of a telluric line. But it is predicted much stronger than observed for the abundance of − 5.1 dex given by the line at 1584.76 nm. This is also the case for the Ce iii line at 1570.9638 nm, which is even not observed. For these two lines, a lowering of the Ce iii abundance up − 7.0 dex is needed to obtain agreement between the observed and computed spectra. An exception is Cr i, for which the two observed lines are both well reproduced by the same abundance.
The abundances for O i, Na i, and P i are upper limits, because there are no lines of these elements observed in the spectrum, while they were predicted for solar abundances (O i at 1074.55 nm, Na i at 1083.487 nm, P i at 1076.9511 nm). For titanium, whose presence is doubtful, we adopted solar abundance.
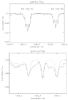 |
Fig. 2 Upper panel: synthetic line profiles (dashed line) calculated for Fe i 15621.7 nm and 15631.9 nm lines using the synthmag code. Lower panel: synthetic line profile (dashed line) for the Fe i 15648.5 nm line. |
We note that line identification in Ap stars with resolved Zeeman split lines can be strengthened by comparing the observed and expected magnetic splitting patterns. In stars with strong fields, both the central line position and the whole line profile shape, as determined by the number and relative strengths of the π and σ components, can serve as a consistency check in the cases where line identification is doubtful. However, such a procedure implies the availability of Landé factors for the majority of the observed spectral lines in the near-IR wavelength region, which is not the case for the currently available atomic data bases.
Synthetic line profiles were also calculated for a few magnetically sensitive iron lines with known Landé factors and showing magnetically split lines. For the synthesis we used the software synthmag developed by Piskunov (1999). The results of our synthesis using this code assuming a surface magnetic field of 4.0 kG, vsini = 0 km s, and an iron abundance − 4.4 dex are presented in Fig. 2.
4.2. HD 154708
This target possesses one of the strongest magnetic fields detected among the Ap stars (Hubrig et al. 2005; 2006). The magnetic field modulus of HD 154708 is very large, of the order of 25 kG. We note that stars with magnetic field strengths that exceed 20 kG are very rare and only very few such strongly magnetic stars were detected so far. HD 154708 has a luminosity and temperature that place it at the cool end of the range of known roAp stars. Kurtz et al. (2006) obtained for this star time series of high-resolution spectra and showed that it indeed belongs to the group of roAp stars. The pulsation takes place with a period of 8 min and the measured radial velocity amplitudes for the rare earth ions Nd iii, Pr ii, and Pr iii are of the order of 60 m s-1.
The magnetic field of HD 154708 is so strong that in our previous studies we were not able to interpret the spectrum in certain optical regions. Many features corresponding to the known transitions were distorted beyond recognition by magnetic splitting.
The optical spectrum of HD 154708 displays the typical abundance pattern of roAp stars with overabundance of rare earth elements along with their clear ionization imbalance, i.e. the third spectra of the rare earths generally give higher abundances by about 1 dex than the second spectra. Using Geneva photometry, Nesvacil et al. (2008) estimated Teff = 6800 K and log g = 4.1. Their abundance analysis revealed that light elements, as well as Ti, Fe, and Ni are underabundant.
Our line identification study indicates the presence of H i, C i, Mg i, Mg ii, Si i, and Fe i lines. Also one Sr ii line, and three lines belonging to the rare-earth element group, Ce iii 1571.58 nm and 1584.76 nm, and Dy ii 1083.594 nm are identified. Nearly 30% of the spectral lines remain unidentified both due to unavailability of atomic data and to the complex structure of the profiles, which sometimes are the blend of the central component of a line with the split component of a nearby line.
Abundances are difficult to determine owing to the structure of the lines. We derived abundances by reproducing the central undisplaced component of the observed profiles. We used 1081.11 nm for Mg i, 1074.938 nm for Si i, and 1484.755 nm for Ce iii. The Fe i lines appear in the spectra unsplit. For most of them the Paschen-Back effect should be at most moderate, if detectable at all. Furthermore, in their vast majority, they have Zeeman patterns that are very close to pure triplets. As a matetr of fact, it is puzzling why we do not observe the magnetic splitting of these lines. The iron abundance was derived from the line at 1562.16 nm. The abundances of the other elements were obtained from the respectively only line observed (C i at 1572.376 nm, Ca i at 1083.897 nm, Cr i at 1101.5679 nm, Sr ii at 1091.4887 nm).
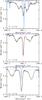 |
Fig. 3 Magnetically split lines belonging to Mg i 1081.11 nm, Si i 1082.71 nm, and Ce iii 1584.76 nm in the CRIRES spectrum of HD 154708. The blue lines in the online version of the article indicate the contribution of the telluric absorptions. Only the central components have been fitted in the line identification process. |
The abundances for Na i, Al i, Ti i, Ni i are upper limits because there are no lines observed for them, although they were predicted for solar abundances (Na i at 1083.487 nm, Al i at 1089.172 nm, Ti i at 1554.3758 nm, and Ni i at 1555.537 nm). Nothing can be said about O i because a strong artifact overlaps the O i line at 1074.55 nm.
In Fig. 3 we present lines of the magnetically split lines belonging to Mg i 1081.11 nm, Si i 1082.71 nm, and Ce iii 1584.76 nm showing a rather similar split Zeeman structure. The structure of the displayed Ce iii 1584.76 nm line, which splits into three components, is very similar to that of the Nd iii 6245.1 Å line previously observed in the optical UVES spectrum by Nesvacil et al. (2008). Numerous examples of magnetically split lines are presented under the link http://wwwuser.oat.ts.astro.it/castelli/stars/.
In Table 3 we present the transitions for a few selected lines showing magnetic splitting. In Cols. 1 to 7 we list laboratory wavelengths, oscillator strengths, excitation potentials for the lower and upper levels, and designations of lower and upper terms.
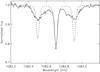 |
Fig. 4 Synthetic line profile (dashed line) calculated for Si i 1082.71 nm in the spectrum of HD 154708 using the synthmag code. |
Our attempt to model the magnetically split lines is presented in Fig. 4, where we tried to calculate the synthetic profile of the line Si i 1082.71 nm using the synthmag code. The interesting feature of the split line profiles in the spectra of HD 154708 is that the σ components are broad, in particular considerably broader than the π components. This indicates that the spread of the field strengths over the visible stellar hemisphere is rather large, probably significantly larger than it would be for a centred dipole. It would be important in the future to prove whether the width of the σ components varies with rotation phase. The splitting of all levels involved in most Si transitions should not significantly depart from the linear Zeeman effect. Furthermore, the Zeeman patterns of most transitions are pure triplets. For the split line Si i 1084.39 nm, assuming LS coupling, the Landé factor is 1.0; for the transitions Si i 1074.94 nm, 1082.71 nm, and 1097.93 nm it is 1.5. From the plot of the line at 1082.71 nm we estimate that the two σ components are separated by 0.41 nm. For a triplet with g = 1.5, this corresponds to a mean field modulus of 25.0 kG. This result is in agreement with the field modulus determinations from the visible.
On the other hand, with a field of 25 kG or more, the upper level of the Si i transition at 1086.88 nm is subject to partial Paschen-Back effect, while the linear Zeeman effect remains an excellent approximation for the lower level. Thus one would expect to see some distortion of the pattern, similar to what happens for the Fe ii lines at 6147.7 − 6149.2 Å in the visual spectrum of this star.
In the absence of a magnetic field, the line at 1081.11 nm results from the superposition of five transitions of Mg i, of which the one at 1081.1053 nm is the strongest. The lower levels of these transitions all belong to the term 3s3d 3D, and all the upper levels belong to the term 3s5f 3F°. The individual transitions correspond to different combinations of the lower and upper J quantum numbers. Within both the lower and the upper term, the levels of different J are separated from each other by less than 0.1 cm-1. Thus in the strong magnetic field of HD 154708, both terms are subject to full Paschen-Back effect, and J ceases to be a “good” quantum number. As a result, the observed line at 1081.11 nm really originates from a single transition between the two terms of interest, which is split by the magnetic field with a pure triplet pattern.
Examples of a few transitions of spectral lines showing magnetic splitting.
The linear Zeeman effect applies for both levels in the transition Sr ii 1091.49 nm. The Zeeman pattern closely resembles a triplet, as separations are small within the pairs of the individual π components and of the individual σ components.
As for the rare earth Ce iii and Dy ii lines, they most frequently display Zeeman patterns that do not depart much from triplets, with Landé factors fairly close to 1. The observed splitting of the Ce iii and Dy ii lines is not inconsistent with this. Admittedly, the red σ component of the line Ce iii at 1584.76 nm appears deeper and narrower than the blue one. We are not sure at present how to explain it since there is absolutely no reason why a departure from linear Zeeman effect should be observable in this line. We note again that the observed σ components are considerably broader than the observed π components, consistent with the previous conclusion about the broad range of values of the field strengths across the stellar disk. A more detailed study of Zeeman splittings observed in this strongly magnetic star is in process and will be presented in a separate paper. The list of all identified lines is presented in Table A.2.
4.3. HD 101412
Among the sample of Herbig Ae/Be stars with detected magnetic fields, HD 101412 showed the largest longitudinal magnetic field, ⟨Bz⟩ = −454 ± 42 G, measured on low-resolution polarimetric spectra obtained with FORS 1 (FOcal Reducer low-dispersion Spectrograph) mounted on the 8-m Kueyen (UT2) telescope of the VLT (Hubrig et al. 2009b). The subsequent study of twelve UVES and HARPS spectra of HD 101412 revealed the presence of resolved magnetically split lines indicating a variable magnetic field modulus changing from 2.5 to 3.5 kG (Hubrig et al. 2010). The search of the rotation period using magnetic and photometric data resulted in P = 42.076 ± 0.017 d (Hubrig et al. 2011). The presence of a rather strong magnetic field on the surface of HD 101412 makes it one of the best candidates for studies of the impact of the magnetic field on the physical processes occurring during stellar formation.
Our previous study of the abundances of HD 101412 using UVES and HARPS spectra indicated that they may reflect a mild λ Boo, or Vega-like abundance mechanism, where the refractory elements are depleted while the most volatile elements are nearly normal (Cowley et al. 2010). The inspection of the spectroscopic material in the visual wavelength region revealed the presence of the elements He, C, N, O, Na, Mg, Al, Si, S, Ca, Sc, Ti, V, Cr, Mn, Fe, Co, Ni, Zn, Sr, Y, Zr, and Ba. Almost all spectral lines showed variations in line intensity and line profile, with the most pronounced variability detected for lines of the elements He, Si, Mg, Ca, Ti, Cr, Fe Sr, Y, Zr, and Ba. Since also the magnetically insensitive lines showed clear profile variations, we concluded that the detected spectral variability is a combination of both Zeeman splitting and abundance spots (Hubrig et al. 2010).
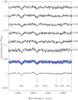 |
Fig. 5 Magnetically sensitive Fe i lines at 15621.7 nm and 15631.9 nm in the CRIRES spectra of HD 101412 after the removal of telluric lines and correction for heliocentric velocity. The spectrum at the bottom displays the average of the six individual spectra obtained at different rotation phases. In the second spectrum from the bottom all six spectra are overplotted. |
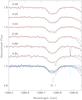 |
Fig. 6 Line profile variations detected in the Si i 1082.7 nm line over the rotation period in the spectra of HD 101412. The smooth overplotted lines (in red colour in the online version) present the average spectrum. The spectrum at the bottom of the figure presents all six spectra overplotted. |
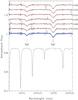 |
Fig. 7 Line profile variations detected in the Mg i 1574.1 nm and 1574.9 nm lines over the rotation period in the spectra of HD 101412. The smooth overplotted lines (in red colour in the online version) present the average spectrum. The telluric spectrum presented at the bottom of the figure was removed from the observed spectrum. The second spectrum from the bottom presents all six spectra overplotted. |
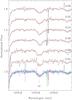 |
Fig. 8 Behaviour of the line profile of N i 1075.8 nm over the rotation period in the spectra of HD 101412. The smooth overplotted lines (in red colour in the online version) present the average spectrum. The spectrum at the bottom of the figure presents all six spectra overplotted. |
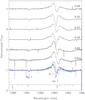 |
Fig. 9 The variability of the He i 1083.0 nm line profile over the rotation period in the spectra of HD 101412. The telluric spectrum presented at the bottom of the figure was removed from the observed spectrum. The second spectrum from the bottom presents all six spectra overplotted. |
All lines identified in the CRIRES spectrum are presented in Table A.3. The majority of the lines belong to the elements Mg and Si, followed by a few lines belonging to N, C, Fe, and Sr. Similar to the analysis at optical wavelengths these elements, apart from N which is overabundant, are underabundant compared to solar abundances. We find that iron is underabundant by ~0.6 dex in both optical and near-IR studies, and the magnetically sensitive Fe i lines 1562.2 nm, 1563.2 nm, and 1564.9 nm appear rather weak in the CRIRES spectrum. No magnetic splitting is evident in these lines, but weak profile variability of the stronger lines Fe i 1562.2 nm and 1563.2 nm appears rather clear, confirming our previous results of Fe line profile variation in the visual wavelength range. In Fig. 5 we present the behaviour of the magnetically sensitive Fe i lines at 15621.7 nm and 15631.9 nm over the rotation period. Variability over the rotation period is also confirmed for the elements Si and Mg, and is less established for N. A few examples of the observed behaviour of the line profiles of Si i, Mg i, and N i are presented in Figs. 6–8.
He i 1083.0 nm is considered as a new diagnostic line to probe inflow (accretion) and outflow (winds) in the star-disk interaction region of accreting T Tauri and Herbig Ae/Be stars. The uniqueness of this probe derives from the metastability of this transition and makes it a good indicator of wind and funnel flow geometry (Edwards et al. 2006). Further, according to Edwards et al., the He i line appears in emission for stronger mass accretion rates and in net absorption for low mass accretion rates. Modeling of this line allowed Gregory et al. (in prep.) for the first time to study the influence of field topologies on the star-disk interaction. Their models use magnetic fields with an observed degree of complexity, as determined via field extrapolation from stellar magnetic maps. Also the recent work of Adams & Gregory (2012) shows that high order field components may even play a dominant role in the physics of the gas inflow as the accretion columns approach the star. In Fig. 9 we present strong variability of this line over the rotation period. The clear variations of the line profile of the He i line indicate that the magnetic field of this star is likely more complex than a dipole field. The work on the modeling of the field geometry on the surface of HD 101412 using this line is currently ongoing (Gregory et al., in prep.).
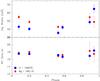 |
Fig. 10 Variation of equivalent widths and radial velocities of the Mg i 1081.1 nm and Si i 1082.7 nm lines over the rotation period in the spectra of HD 101412. |
Measurements of equivalent widths and radial velocities of the most clean spectral lines Mg i 1081.1 nm and Si i 1082.7 nm in the CRIRES spectrum confirm our previous finding on the existence of chemical spots on the stellar surface (Hubrig et al. 2010). The character of variations appears to be very similar to that found in optical spectra where the equivalent width minimum is observed at the phase close to the positive extremum of the longitudinal magnetic field. In Fig. 10 we present the variation of equivalent widths and radial velocities of the two lines Mg i 1081.1 nm and Si i 1082.7 nm.
No spectral lines belonging to exotic elements, such as the lanthanide rare earths, or heavier elements were identified in the spectrum of HD 101412.
4.4. 51 Oph (=HD 158643)
This target is a 0.7 Myr old B9 Herbig star with Teff = 10 250 K and log g = 3.57 (Montesinos et al. 2009, and references therein). According to Mora et al. (2001) it is one of the fastest rotating Herbig Ae/Be stars with vsini = 256 km s-1. The huge rotational line broadening prevents the reliable identification of spectral lines apart from the Mg i line at 1081.1 nm, the He i 1083.0 nm line, and the Paγ line. We note, however, that we fitted these lines using vsini = 100 km s-1. The large difference between this value and the vsini value determined by Mora et al. is probably due to our difficulties of putting a proper continuum in the observed CRIRES spectrum covering the very short length of ~5 nm.
Interferometric observations with AMBER indicate that the system is observed almost edge-on with an inclination of the disk of i = 82° (Tatulli et al. 2008). This value is similar to the inclination i = 80 ± 7° of the disk of HD 101412, which was derived from resolved observations of the disk using VLTI/MIDI (Fedele et al. 2008). Using the value for the radius R = 5.6 R⊙ from the work of Montesinos et al. and the vsini = 256 km s-1 from Mora et al. (2001), the expected rotation period is of the order of 1.1 d.
Not much is known about the presence of a magnetic field in this star. FORS 1 spectropolarimetric observations were carried out by Hubrig et al. (2009b). The single measurement ⟨Bz⟩ = 32 ± 20 G does not indicate the presence of a significant magnetic field during that observing epoch.
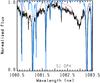 |
Fig. 11 The He i 1083.0 nm and Mg i 1081.1 nm lines in the spectrum of the Herbig Be star 51 Oph. |
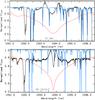 |
Fig. 12 The Paγ line in the spectra of the Herbig stars HD 101412 and 51 Oph. |
In Figs. 11 and 12 we present the He i 1083.0 nm line, which appears in absorption, and the Paγ line displaying two emission peaks, respectively. The shape of the emission profile resembles that of the Herbig Ae star HD 101412 presented in the same figure, but is much broader.
5. Discussion
In this work we use high quality near-IR spectra in a few spectral regions to understand their diagnostic potential. The presented line lists of identified and unidentified spectral features provide important line data for laboratory spectroscopists and for testing and improving models of stellar atmospheres. The identification work clearly shows that the knowledge of the spectral features in near-IR wavelength regions is far from complete and that there is a strong need for additional atomic data, especially for exotic elements, such as the lanthanide rare earths and heavy elements. For example, the identification of rare earths lines is of special interest in the studies of roAp stars as the radial velocity oscillation amplitude for these lines is significantly higher than that for iron-peak elements (e.g. González et al. 2008).
Many lines in the spectra of the magnetic Ap stars appear magnetically split, but only for some of them are Landé factors known. The knowledge of magnetic sensitive lines in the near-IR region will allow future studies to prove the presence of weak magnetic fields in intermediate-mass stars not previously known to possess magnetic fields.
The content of the spectra of the studied Herbig Ae/Be stars is rather unexciting. Variable behaviour of lines of the elements He, N, Mg, Si, and Fe in the spectra of the magnetic Herbig Ae star HD 101412 over the rotation period confirm our previous finding of variability in the optical spectra.
Our work can be considered as a pilot project since the obtained CRIRES spectra cover a rather small part of the near-IR wavelength region. Clearly more complete studies based on spectra obtained at all near-IR wavelengths from J to M band are needed to refine the analysis of intermediate-mass stars.
Online material
Appendix A: Tables presenting the line identifications for the two classical Ap stars γ Equ and HD 154708, and the Herbig Ae star HD 101412
List of lines observed in the CRIRES spectrum of γ Equ.
List of lines observed in the CRIRES spectrum of HD 154708.
List of lines observed in the CRIRES spectrum of HD 101412 at the phase 0.94.
Kurucz, R. L. (2007), http://kurucz.cfa.harvard.edu/atoms/2600/gf2600.pos
Acknowledgments
We thank E. Biémont for providing us with the oscillator strengths for Ce iii lines. We would also like to thank the anonymous referee for his valuable comments. Our research made use of Kurucz’s atomic line lists and NIST and VALD databases.
References
- Adams, F. C., & Gregory, S. G. 2012, ApJ, 744, 55 [NASA ADS] [CrossRef] [Google Scholar]
- Babcock, H. W. 1958, ApJS, 3, 141 [NASA ADS] [CrossRef] [Google Scholar]
- Cowley, C. R., Hubrig, S., González, J. F., & Savanov, I. 2010, A&A, 523, A65 [NASA ADS] [CrossRef] [EDP Sciences] [Google Scholar]
- Edwards, S., Fischer, W., Hillenbrand, L., & Kwan, J. 2006, ApJ, 646, 319 [NASA ADS] [CrossRef] [Google Scholar]
- Fedele, D., van den Ancker, M. E., Acke, B., et al. 2008, A&A, 491, 809 [NASA ADS] [CrossRef] [EDP Sciences] [MathSciNet] [Google Scholar]
- Freyhammer, L. M., Kurtz, D. W., Elkin, V. G., et al. 2009, MNRAS, 396, 325 [NASA ADS] [CrossRef] [Google Scholar]
- González, J. F., Hubrig, S., Kurtz, D. W., et al. 2008, MNRAS, 384, 1140 [NASA ADS] [CrossRef] [Google Scholar]
- Heiter, U., Barklem, P., Fossati, L., et al. 2008, J. Phys. Conf. Ser., 130, 012011 [NASA ADS] [CrossRef] [Google Scholar]
- Hubrig, S., North, P., & Mathys, G. 2000, ApJ, 539, 352 [NASA ADS] [CrossRef] [Google Scholar]
- Hubrig, S., Nesvacil, N., Schöller, M., et al. 2005, A&A, 440, L37 [NASA ADS] [CrossRef] [EDP Sciences] [Google Scholar]
- Hubrig, S., North, P., Schöller, M., & Mathys, G. 2006, Astron. Nachr., 327, 289 [NASA ADS] [CrossRef] [Google Scholar]
- Hubrig, S., North, P., & Schöller, M. 2007, Astron. Nachr., 328, 475 [NASA ADS] [CrossRef] [Google Scholar]
- Hubrig, S., Stelzer, B., Schöller, M., et al. 2009a, A&A, 502, 283 [NASA ADS] [CrossRef] [EDP Sciences] [Google Scholar]
- Hubrig, S., Mathys, G., Kurtz, D. W., et al. 2009b, MNRAS, 396, 1018 [NASA ADS] [CrossRef] [Google Scholar]
- Hubrig, S., Schöller, M., Savanov, I., et al. 2010, Astron. Nachr., 331, 361 [NASA ADS] [CrossRef] [Google Scholar]
- Hubrig, S., Mikulášek, Z., González, J. F., et al. 2011, A&A, 525, L4 [NASA ADS] [CrossRef] [EDP Sciences] [Google Scholar]
- Kupka, F., Piskunov, N., Ryabchikova, T. A., et al. 1999, A&AS, 138, 119 [NASA ADS] [CrossRef] [EDP Sciences] [MathSciNet] [PubMed] [Google Scholar]
- Kurtz, D. W. 1983, MNRAS, 202, 1 [NASA ADS] [Google Scholar]
- Kurtz, D. W. 1990, ARA&A, 28, 607 [NASA ADS] [CrossRef] [Google Scholar]
- Kurucz, R. L. 1993, SYNTHE Spectrum Synthesis Programs and Line Data. Kurucz CD-ROM No. 18, Cambridge, Mass.: Smithsonian Astrophysical Observatory, 18 [Google Scholar]
- Kurtz, D. W., Elkin, V. G., Cunha, M. S., et al. 2006, MNRAS, 372, 286 [NASA ADS] [CrossRef] [Google Scholar]
- Libbrecht, K. G. 1988, ApJ, 330, L51 [NASA ADS] [CrossRef] [Google Scholar]
- Meléndez, J., & Barbuy, B. 1999, ApJS, 124, 527 [NASA ADS] [CrossRef] [MathSciNet] [Google Scholar]
- Montesinos, B., Eiroa, C., Mora, A., & Merín, B. 2009, A&A, 495, 901 [NASA ADS] [CrossRef] [EDP Sciences] [Google Scholar]
- Mora, A., Merín, B., Solano, E., et al. 2001, A&A, 378, 116 [NASA ADS] [CrossRef] [EDP Sciences] [Google Scholar]
- Nesvacil, N., Hubrig, S., & Khan, S. 2008, in ESO Astrophysics Symposia, Precision Spectroscopy in Astrophysics, ed. N. C. Santos, L. Pasquini, A. C. M. Correia, & M. Romaniello (Berlin/Heidelberg/New York: Springer), 305 [Google Scholar]
- Outred, M. 1978, J. Phys. Chem. Ref. Data, 7, 1 [NASA ADS] [CrossRef] [Google Scholar]
- Piskunov, N. E. 1999, in Solar polarization, ed. K. N. Nagendra, & J. O. Stenfl, (Dordrecht: Kluwer Academic Publishers), ASSL, 243, 515 [Google Scholar]
- Ryabchikova, T. A., Adelman, S. J., Weiss, W. W., et al. 1997, A&A, 322, 234 [NASA ADS] [Google Scholar]
- Tatulli, E., Malbet, F., Menard, F., et al. 2008, A&A, 489, 1151 [NASA ADS] [CrossRef] [EDP Sciences] [Google Scholar]
- Warner, B. 1968, MNRAS, 139, 115 [NASA ADS] [Google Scholar]
All Tables
All Figures
|
Fig. 1 Example for the removal of telluric lines in two spectral regions. Upper panel, from top to bottom: spectra of four standard stars, scaled telluric spectrum, object (=HD 101 412) spectrum, and cleaned object spectrum. Lower panel, from top to bottom: object (=HD 101412) spectrum, telluric line master spectrum (calculated by averaging seven standard star spectra), object spectrum after removing the telluric lines. |
| In the text | |
|
Fig. 2 Upper panel: synthetic line profiles (dashed line) calculated for Fe i 15621.7 nm and 15631.9 nm lines using the synthmag code. Lower panel: synthetic line profile (dashed line) for the Fe i 15648.5 nm line. |
| In the text | |
|
Fig. 3 Magnetically split lines belonging to Mg i 1081.11 nm, Si i 1082.71 nm, and Ce iii 1584.76 nm in the CRIRES spectrum of HD 154708. The blue lines in the online version of the article indicate the contribution of the telluric absorptions. Only the central components have been fitted in the line identification process. |
| In the text | |
|
Fig. 4 Synthetic line profile (dashed line) calculated for Si i 1082.71 nm in the spectrum of HD 154708 using the synthmag code. |
| In the text | |
|
Fig. 5 Magnetically sensitive Fe i lines at 15621.7 nm and 15631.9 nm in the CRIRES spectra of HD 101412 after the removal of telluric lines and correction for heliocentric velocity. The spectrum at the bottom displays the average of the six individual spectra obtained at different rotation phases. In the second spectrum from the bottom all six spectra are overplotted. |
| In the text | |
|
Fig. 6 Line profile variations detected in the Si i 1082.7 nm line over the rotation period in the spectra of HD 101412. The smooth overplotted lines (in red colour in the online version) present the average spectrum. The spectrum at the bottom of the figure presents all six spectra overplotted. |
| In the text | |
|
Fig. 7 Line profile variations detected in the Mg i 1574.1 nm and 1574.9 nm lines over the rotation period in the spectra of HD 101412. The smooth overplotted lines (in red colour in the online version) present the average spectrum. The telluric spectrum presented at the bottom of the figure was removed from the observed spectrum. The second spectrum from the bottom presents all six spectra overplotted. |
| In the text | |
|
Fig. 8 Behaviour of the line profile of N i 1075.8 nm over the rotation period in the spectra of HD 101412. The smooth overplotted lines (in red colour in the online version) present the average spectrum. The spectrum at the bottom of the figure presents all six spectra overplotted. |
| In the text | |
|
Fig. 9 The variability of the He i 1083.0 nm line profile over the rotation period in the spectra of HD 101412. The telluric spectrum presented at the bottom of the figure was removed from the observed spectrum. The second spectrum from the bottom presents all six spectra overplotted. |
| In the text | |
|
Fig. 10 Variation of equivalent widths and radial velocities of the Mg i 1081.1 nm and Si i 1082.7 nm lines over the rotation period in the spectra of HD 101412. |
| In the text | |
|
Fig. 11 The He i 1083.0 nm and Mg i 1081.1 nm lines in the spectrum of the Herbig Be star 51 Oph. |
| In the text | |
|
Fig. 12 The Paγ line in the spectra of the Herbig stars HD 101412 and 51 Oph. |
| In the text | |
Current usage metrics show cumulative count of Article Views (full-text article views including HTML views, PDF and ePub downloads, according to the available data) and Abstracts Views on Vision4Press platform.
Data correspond to usage on the plateform after 2015. The current usage metrics is available 48-96 hours after online publication and is updated daily on week days.
Initial download of the metrics may take a while.