Free Access
Fig. 6
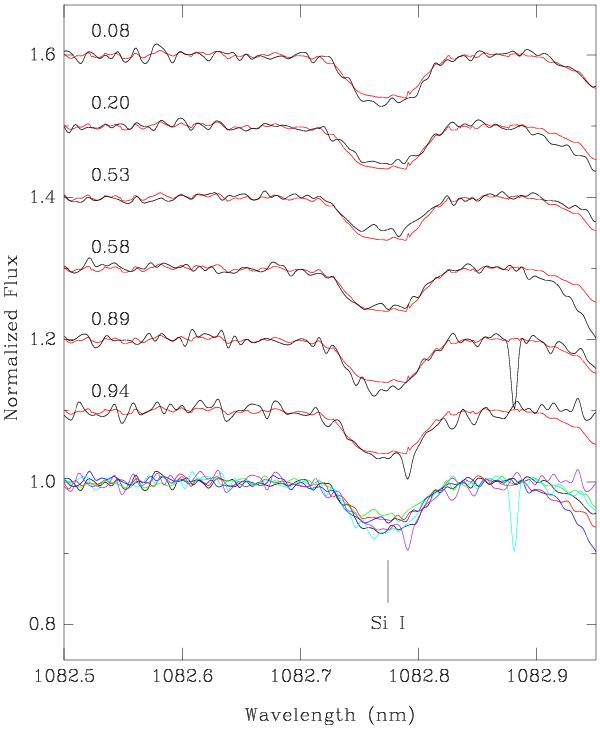
Line profile variations detected in the Si i 1082.7 nm line over the rotation period in the spectra of HD 101412. The smooth overplotted lines (in red colour in the online version) present the average spectrum. The spectrum at the bottom of the figure presents all six spectra overplotted.
Current usage metrics show cumulative count of Article Views (full-text article views including HTML views, PDF and ePub downloads, according to the available data) and Abstracts Views on Vision4Press platform.
Data correspond to usage on the plateform after 2015. The current usage metrics is available 48-96 hours after online publication and is updated daily on week days.
Initial download of the metrics may take a while.