| Issue |
A&A
Volume 542, June 2012
|
|
|---|---|---|
| Article Number | A50 | |
| Number of page(s) | 17 | |
| Section | Stellar structure and evolution | |
| DOI | https://doi.org/10.1051/0004-6361/201218872 | |
| Published online | 05 June 2012 | |
The VLT-FLAMES Tarantula Survey
V. The peculiar B[e]-like supergiant, VFTS698, in 30 Doradus⋆,⋆⋆
1 Department of Physics & AstronomyThe Queen’s University of Belfast, BT7 1NN, Northern Ireland, UK
e-mail: This email address is being protected from spambots. You need JavaScript enabled to view it.
2 Department of Physics and Astronomy, The Open University, Walton Hall, Milton Keynes, MK7 6AA, UK
3 Department of Physics & Astronomy, University of Sheffield, Sheffield S3 7RH, UK
4 UK Astronomy Technology Centre, Royal Observatory Edinburgh, Blackford Hill, Edinburgh, EH9 3HJ, UK
5 ESA, Space Telescope Science Institute, 3700 San Martin Drive, Baltimore, MD 21218, USA
6 Warsaw University Observatory, Al. Ujazdowskie 4, 00-478 Warszawa, Poland
7 Institute for Astronomy, Royal Observatory Edinburgh, Blackford Hill, Edinburgh, EH9 3HJ, UK
8 Armagh Observatory, College Hill, Armagh BT61 9DG, Northern Ireland, UK
Received: 23 January 2012
Accepted: 4 April 2012
Abstract
Aims. We present an analysis of a peculiar supergiant B-type star (VFTS698/Melnick 2/Parker 1797) in the 30 Doradus region of the Large Magellanic Cloud which exhibits characteristics similar to the broad class of B[e] stars.
Methods. We analyse optical spectra from the VLT-FLAMES survey, together with archival optical and infrared photometry and X-ray imaging to characterise the system.
Results. We find radial velocity variations of around 400 km s-1 in the high excitation Si iv, N iii and He ii spectra, and photometric variability of ~0.6 mag with a period of 12.7 d. In addition, we detect long-term photometric variations of ~0.25 mag, which may be due to a longer-term variability with a period of ~400 d.
Conclusions. We conclude that VFTS698 is likely an interacting binary comprising an early B-type star secondary orbiting a veiled, more massive companion. Spectral evidence suggests a mid-to-late B-type primary, but this may originate from an optically-thick accretion disc directly surrounding the primary.
Key words: stars: early-type / binaries: spectroscopic / stars: peculiar / stars: emission-line, Be / stars: variables: general
Based on observations at the European Southern Observatory Very Large Telescope in programme 182.D-0222.
Table 8 is available in electronic form at http://www.aanda.org
© ESO, 2012
1. Introduction
Massive stars, whilst intrinsically rare due to the slope of the initial mass function (Salpeter 1955), have an important role in influencing their surroundings. As the progenitors of core-collapse supernovae (e.g. Smartt 2009), they inject both nuclear processed material and energy into the interstellar medium. Additionally their high luminosity permit us to observe them beyond the Milky Way (e.g. Massey 2003; Levesque et al. 2005; Massey et al. 2009), providing a crucial test of stellar evolution at different metallicities.
Variability is a defining characteristic for several of the subclasses of massive stars, e.g., luminous blue variables (LBVs) and Cepheids. Such variability can take a wide variety of forms: pulsations in Cepheids can give rise to stable, periodic light-curves, while LBVs undergo irregular and unpredictable eruptive outbursts (e.g. the most famous, Eta Carina, van Genderen & Thé 1984) which can lead to sudden increases in magnitude. Individual types of massive stars can also display more than one type of variability, for example some LBVs can also display gradual changes in magnitude over timescales of years.
Spectroscopic and photometric variability in massive stars can also be caused by binarity, with as many as 40% of massive stars found to have binary companions (B-type: Dunstall et al. to be submitted, O-type: Sana et al. to be submitted). Tarasov (2000) presented a review of short-period interacting binaries which give rise to emission-line phenomena during the course of their evolution. Short-period variability (~5 d) in emission features is associated with “classical Algol” objects, whereas variability of the order of tens of days can be seen in W Serpentis binaries or double periodic variables (DPVs, Plavec et al. 1980; Mennickent et al. 2003).
B[e] supergiants (sgB[e]) are the most homogeneous and distinct group of stars that show the “[e]” phenomenon (Lamers et al. 1998). Their spectra are characterised by the presence of narrow emission from both permitted and forbidden lines of iron-group elements. SgB[e] stars have high luminosities (log L/L⊙ > 4) and are therefore easily observable in the Magellanic Clouds. Ten sgB[e]s in the Large Magellanic Cloud (LMC) are well documented1, allowing concise criteria to be placed upon the characterisation of these stars (Lamers et al. 1998). They show a possible evolutionary connection to LBVs, e.g., Herrero et al. (2010), defined V39 in the Small Magellanic Cloud (SMC) as either an LBV candidate or a sgB[e]. In addition, sgB[e]s may be the result of binary mergers (Podsiadlowski et al. 2006), although their exact nature remains unclear at present.
In this paper we document the spectral and photospheric characteristics of an intriguing radial velocity (RV) variable from the VLT-FLAMES Tarantula Survey (Evans et al. 2011, VFTS; hereafter Paper I). The target, VFTS698, has previously been known as Melnick 2 (Melnick 1985) and Parker 1797 (Parker 1993). Section 2 presents the optical spectroscopy of VFTS698, as well as archival optical, infrared (IR) and X-ray imaging. The observational characteristics of VFTS698 are discussed in Sect. 3, in addition to a preliminary analysis. VFTS698 has previously been characterised as a B3 Ia star by Walborn & Blades (1997) and “early Be” by Bosch et al. (1999), but in Sect. 3.3 we present our own classification based on the properties determined here. Section 4 documents the associated atmospheric parameters, including an estimate of the nitrogen abundance. We compare VFTS698 with a number of other sgB[e] stars and interacting binary objects in Sect. 5, as well as presenting a plausible evolutionary scenario. Our conclusions are drawn up in Sect. 6.
2. Observations
2.1. Optical spectroscopy
Spectroscopy of VFTS698 was obtained as part of the Tarantula Survey, using the Fibre Large Array Multi-Element Spectrograph (FLAMES) on the Very Large Telescope (VLT) with the Giraffe spectrograph. The star was observed as part of “Field B” of the survey, for which the observational epochs are listed in the Appendix of Paper I. Three of the Giraffe wavelength settings were used, as summarised in Table 1.
The data reduction was discussed at length in Paper I. In brief, the data were reduced using the European Southern Observatory (ESO) Common Pipeline Library FLAMES package, and consisted of flat-fielding, bias subtraction and wavelength calibration. Separate fibres were used to observe the sky in each exposure, with the average sky spectrum then subtracted from each of the science targets. However, as discussed in Paper I, this often leads to imperfect nebular subtraction. In particular, VFTS698 is embedded in a H ii region with strong nebular emission lines which vary over small spatial scales, so accurate nebular subtraction was not possible.
Cross-talk between fibres on the array can be a source of contamination between objects (see Paper I). This was investigated for VFTS698 using the LR03 frames. An increase of less than 1% in the typical inter-fibre flux was found between VFTS698 and one of the adjacent stars on the array (VFTS591). Such a small contribution to the flux of VFTS698 should not significantly affect our analysis.
Observational spectroscopy for VFTS698.
The extracted spectra were normalised over the entire spectral region for each setting, or, for features of particular interest, in smaller wavelength regions. On occasions the richness of the spectra make it difficult to identify line-free regions – the implications of this for the silicon spectra are discussed in Sect. 4. Individual exposures were normalised using low-order polynomials, with a sigma-clipping algorithm used to exclude cosmic-rays within defined continuum windows. Spectra within an epoch and, where appropriate, between epochs were combined using a weighted average together with sigma-clipping. Adopting a median spectrum leads to very similar results indicating that the choice of algorithm for combining individual exposures was unlikely to be a significant source of error.
2.2. Photometry
Photometry of VFTS698 is available from the Optical Gravitational Lensing Experiment III (OGLE-III) survey (Udalski et al. 2008, and references therein), comprising multi-epoch observations over eight seasons from October 2001 to April 2009. I-band photometry for VFTS698 was obtained from the OGLE database (see Udalski 2003, for further details) and is shown in Fig. 1, in which the mean and median measurements for each observing season are over-plotted. Note that most of the FLAMES spectroscopy is contemporaneous with the last block of OGLE-III data.
We have supplemented the OGLE-III photometry with V-band observations from the 2-m Faulkes Telescope South (FTS), obtained as part of a monitoring programme of 30 Dor during 2009 and 2010. The observations employed the FTS Merope camera, which has a field-of-view of 4 7 × 47 and a (rebinned) pixel size of 0
 278/pixel. Images obtained in seeing of greater than 2′′ were rejected, leaving 39 observations of the field including VFTS698. Differential aperture photometry was obtained for VFTS698 via comparison with five (non-variable) stars of comparable brightness in the same field.
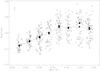 |
Fig. 1 I-band light-curve of OGLE-III data from 8 years of observations. VFTS698 shows a short-term variation of ~0.2 mag, increasing up to ~0.5 mag with time. Solid circles and squares show the mean and median values, respectively, for each block. The typical uncertainty associated with the OGLE-III data is ± 0.015 mag, as illustrated in the upper left of the figure. |
To investigate its near-IR behaviour, the Spitzer Archive2 was searched for photometry of VFTS698 and nearby sources with comparable V-band magnitudes. Observations with the 3.6, 4.5, 5.8 and 8.0 μm filters are available from the Spitzer Legacy Science Program (Meixner et al. 2006, SAGE), with photometry from the survey for known massive stars presented by Bonanos et al. (2009).
Four B-type stars with similar V-band magnitudes (including VFTS450, an O9.7 star) are located within 2′ of VFTS698. While VFTS698 was detected in all filters, this was not the case for the comparison objects. For common detections, VFTS698 was found to be on average 2 mag brighter at 3.6 μm, 1.5 mag at 4.5 μm, 2 mag at 5.8 μm, and the only object detected at 8.0 μm. Representative visual and IR magnitudes are summarised in Table 2, although we emphasise that VFTS698 is photometrically variable.
2.3. X-ray data
We searched the Chandra Data Archive3 for images of the region including VFTS698. Archival images with the ACIS-I instrument of this part of 30 Dor are available from 21 Sept. 1999, and 21, 22 and 30 Sept. 2006. The primary data products from the Chandra X-ray Centre’s automated processing were downloaded and examined, but no obvious source was found coincident with VFTS698. This supports the analysis of the 1999 data by Townsley et al. (2006) who did not report a detection at the position of VFTS698 (given a lower detection limit of 5 counts in 21 870 s, which equates to a limiting full-band luminosity of ~1 × 1033 erg s-1, with the brightest source detected being <1036 erg s-1).
We reprojected all of the available individual exposures to a common pointing and stacked them to create a deep image with an effective exposure time of 120 ks. The deep, merged image (Fig. 2) was filtered to only include photons with energies in the range of 0.3 to 10 keV and a wavelet algorithm was used to detect point sources. Even when an extremely low significance threshold was used (corresponding to a false positive rate among the detections of 20%), no source was found to be coincident with, or close to, VFTS698.
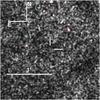 |
Fig. 2 Merged Chandra image (smoothed for legibility) of the region surrounding VFTS698 (marked by the white crosshairs). |
3. Observational properties and preliminary analysis
3.1. Optical photometry
From Fig. 1 there is clear evidence for photometric variability of ~0.6 mag on timescales ranging from days to years. Two separate trends can be identified: short-term variability with a period of 12.7 ± 0.1 d, and a longer-term variation with timescales of at least several hundred days.
The short-term variation is illustrated in Fig. 3. Within the observational uncertainty the period appears to be constant between epochs, but the amplitude of the periodicity increases in magnitude over the 8 years, from ~0.10 to ~0.25 mag. Each observation block was analysed individually by means of a Lomb-Scargle periodogram, confirming the consistency of the 12.7 d period.
The long-term trend appears to consist of a steady increase in the mean I-band magnitude of ~0.3 mag over a period of some years, which may have reached a maximum at MJD ~ 54 500 (see Fig. 1). To investigate any possible periodicity in this trend, a Lomb-Scargle periodogram was produced from the I-band photometry, but now restricted to a period range of 100 to 1000 d. The result of this indicated a period of 400 ± 21 d, but upon folding the period to the complete I-band observations, no periodic phase is apparent (left-hand panel of Fig. 4). The difficulty in identifying any periodicity in this long-term variation is due to the large brightness changes associated with the 12.7 d period. When the mean magnitudes for each block are plotted against the median phase a more convincing variation is found, as shown by the right-hand panel of Fig. 4.
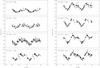 |
Fig. 3 OGLE-III I-band photometry of VFTS698 folded with a 12.7 d period. Left-hand panel: first four blocks of observations; right-hand panel: blocks five to eight. For clarity two periods have been plotted for each observation block. |
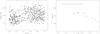 |
Fig. 4 Left-hand panel: I-band OGLE-III photometry of VFTS698 folded to a 400 d period. Right-hand panel: the median magnitude and date for each block of OGLE-III I-band data as a function of phase. The bar indicates the typical phase coverage by each block. |
As discussed in Sect. 2.2, VFTS698 was also observed over an 11 month period in the V-band with the FTS. These data were found to be in good agreement with the OGLE-III data; a Lomb-Scargle periodogram yielded a period of 12.7 ± 0.1 d (hereafter referred to as the 12.7 d period) with a photometric amplitude of ~0.25 mag. The phased light-curve from the FTS data is shown in Fig. 5.
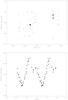 |
Fig. 5 Upper panel: differential V-band photometry of VFTS698 from 11 months of FTS observations (open circles). Mean and median magnitudes for the two seasons are indicated by solid circles and squares, respectively. Lower panel: FTS photometry folded to a 12.7 d period. |
3.2. Infrared photometry
The near- and mid-IR colours of VFTS698 are compared to other massive stars in the LMC in Figs. 6 and 7; near-IR photometry is from the InfraRed Survey Facility (IRSF, Kato et al. 2007) and longer wavelengths are from the Spitzer SAGE survey. To investigate its behaviour, we also include results for VFTS1003, the B[e] star discussed in Paper I. As shown in the figures, both VFTS698 and VFTS1003 display significant IR excesses over “normal” OBA-type supergiants.
VFTS698 is clearly displaced from the region of the colour/colour plots occupied by sgB[e] stars. At mid-IR wavelengths it is co-located with other massive stars such as LBVs and Wolf-Rayet (WR) stars, which are known to support strong dense winds resulting in copious thermal free-free emission at near- to mid-IR wavelengths4. The near-IR colours of VFTS698 are bluer than bona fide sgB[e] stars, but they indicate a greater continuum excess than found for either the LBVs or WRs. The origin of the IR continuum emission in VFTS698 is therefore uncertain; in Sect. 5 we argue that it appears likely to arise (at least partially) in an ionised stellar wind or gaseous circumstellar/binary disc, although an additional component from hot dust would also appear possible.
In contrast, we note that VFTS1003 is co-located with the sgB[e] stars in Figs. 6 and 7, suggesting the presence of a warm (~600 K, see Sect. 5) circumstellar dust. Note that there is some ambiguity regarding the classification of VFTS1003 in Paper I, with it potentially a sub-luminous sgB[e] or an over luminous, pre-main sequence “Herbig” B[e] star. The near- and mid-IR photometry would appear to support the sgB[e] classification, but the close proximity of VFTS1003 to the central region of 30-Dor casts doubt on the reliability of the Spitzer photometry.
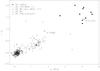 |
Fig. 6 J − Ks colour vs. Ks − [8.0] colour for VFTS698, other emission-line objects and OBA-type supergiants in the LMC. The recently discovered B[e] star VFTS1003 is also shown for comparison. Note that strong emission lines are also expected to contribute to the near-IR continuum emission of WC stars. |
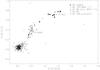 |
Fig. 7 Mid-IR colours for VFTS698, other emission-line objects and OBA-type supergiants in the LMC. VFTS698 appears to have an IR-excess greater than normal OBA supergiants, but not to the same extent as other sgB[e] stars. |
Photometry of VFTS698 and four nearby, early B-type (or late O) VFTS sources with comparable V-band magnitudes.
3.3. Spectral classification and luminosity
VFTS698 shows a rich absorption- and emission-line spectrum, as illustrated in Figs. 8 and 10. Lamers et al. (1998) presented an overview of the sub-classification of B[e] stars, from which we classify VFTS698 as a B[e] supergiant. Our two primary criteria were the presence of forbidden emission lines and a large luminosity. In addition, five secondary criteria were considered: indications of mass-loss from double-peaked Balmer emission lines; presence of narrow, low-excitation emission lines and broad, higher-excitation absorption lines; a strong nitrogen spectrum; a large extinction; photometric variability. For the last point, VFTS698 shows larger variations than most sgB[e] objects (typically 0.1 to 0.2 mag), but it is not unique – e.g. R4 in the SMC displays comparable variability (Zickgraf et al. 1996). The strong photometric variability and mid-IR colours appear to weaken the sgB[e] classification, but there remains sufficient evidence to justify the classification as an early-type supergiant with “[e]” phenomena.
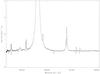 |
Fig. 8 Optical spectroscopy of the HR15N observations of VFTS698. See Fig. 10 for details on the LR02 and LR03 settings. |
The photometric variability of VFTS698 makes its luminosity difficult to estimate. However we can use a number of constraints to obtain a best estimate. Using the photometry from Table 2, adopting (B − V)0 = − 0.24 mag and a distance modulus of 18.5 (Alves 2004) to the LMC, we obtain E(B − V) = 0.6 mag and MV = −6.7 mag. Adopting an appropriate bolometric correction for an early B-type supergiant ( − 2.4 mag, see Crowther et al. 2006) results in a bolometric magnitude of − 9.1 mag, equivalent to log L/L⊙ = 5.6.
3.4. Spectral characteristics
We now discuss the FLAMES spectra, which appear to have three distinct components:
-
Characteristic sgB[e] spectrum: low-excitation permitted andforbidden lines from iron-group elements;
-
Cool component: absorption lines from species consistent with a mid-B spectral classification, e.g., He i and Si ii;
-
Hot component: high-ionisation stages (N iii, Si iv and He ii), consistent with an early B- or late O-type spectrum.
The apparently cool features display small RV variations, with far larger variations in the lines attributable to a hot component. The RV variations of example metal and helium lines (Si iv, N iii and He i) are shown in Fig. 9. We now consider these different components in turn, although there is inevitably some overlap in the discussion.
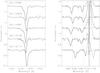 |
Fig. 9 Example RV variations displayed by helium and metal lines. Fitted Gaussian profiles are over-plotted and rest wavelengths are indicated by the vertical dashed lines. Left-hand panel: He i 4437 Å, in which the “hot”, second component is noted by the marks above the continuum. Right-hand panel: Si iv 4089 Å and N iii 4097 Å. |
3.4.1. Characteristic sgB[e] spectrum
To inform the description of VFTS698, Fig. 10 compares the LR02 data with spectra of two sgB[e] stars in the SMC, obtained with the Cassegrain Echelle Spectrograph (CASPEC) on the ESO 3.6-m telescope (degraded and rebinned to match the resolution of FLAMES). Zickgraf et al. (1996) noted the prominent emission of the Balmer and Fe ii lines (both permitted and forbidden) in R4. Similar Fe ii features are seen in VFTS698, but they are accompanied by narrow absorption lines (see Fig. 11); such structure is also seen in the Ti ii and Cr ii lines in VFTS698. This two-component structure is not seen in R4, but is present in R50 (Zickgraf et al. 1986, upper spectrum in Fig. 10).
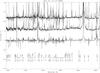 |
Fig. 10 The combined LR02 and LR03 spectra of VFTS698 (lower spectrum), compared with two sgB[e] stars in the SMC: R50 (upper spectrum, from Zickgraf et al. 1986) and R4 (middle spectrum, from Zickgraf et al. 1996; Podsiadlowski et al. 2006). |
The most prominent permitted lines of Fe ii are due to the multiplets 27, 28, 37 and 38, with an excitation potential ~2.7−5.6 eV (similar to those identified by Zickgraf et al. 1996), whilst for Ti ii and Cr ii, they are due to multiplets 41 and 31, with an excitation potential ~1.2−4.0 eV and ~3.9−6.8 eV, respectively. The forbidden transitions mainly originate from [Fe ii] multiplets 4F, 6F, 7F, 20F and 21F, with excitation potentials of 0.1–3.0 eV. A number of other forbidden lines are also detected, including [Fe iii] at 4658, 4701, and 4733 Å, [N ii] at 6548 and 6583 Å, and [S ii] at 6717 and 6730 Å. However, it is unclear if the forbidden transitions of [N ii] and [S ii] originate from material directly associated with VFTS698 as these features are also observed in the FLAMES spectra of other nearby objects, where they originate from the strong nebular emission in 30 Dor (Paper I).
The narrow-lined, iron-group absorption features have been fitted with Gaussian profiles to estimate RVs. This was performed for all epochs of LR02 spectroscopy, and no evidence for RV variations was found, with a mean RV of 259 km s-1 and a sample standard deviation of ± 15 km s-1. This spectral component appears to lie close to the rest frame of 30 Dor, as measured from over two hundred B-type stars ( ⟨ RV ⟩ = 270 ± 17 km s-1, Kennedy et al. to be submitted). The low excitation potentials of the iron-group spectrum, together with the RV measurements which indicate a static environment, suggest they originate within low density, circumstellar material.
3.4.2. Cool component
Absorption lines from N ii, Si ii and Mg ii are observed in the spectrum of VFTS698 with profiles that are broader than those from the iron-group species discussed above. There is also a strong neutral helium spectrum, unusual for objects exhibiting B[e] features, which show a two-component structure (see Fig. 9).
As discussed below the He i diffuse triplet lines show varying P Cygni profiles but the singlet lines appear reasonably symmetric. Determinations of the RVs of the stronger component of these singlet lines and of the singly-ionised silicon and magnesium transitions indicate that they probably originate from the same source. The He i transitions show consistent RV measurements within an epoch (with a sample standard deviation of ± 15 km s-1) but with a variation of 33 ± 11 km s-1 over the five spectroscopic epochs. The Si ii and Mg ii lines were subject to blending that made accurate estimates difficult, but both species were found to have RVs within typically ~20 km s-1 of those of the He i lines. If we consider these lines to originate from a single plasma, this could be the B[e] supergiant photosphere with a mid-B spectral classification. Additionally a Lomb-Scargle periodogram for the He i RV estimates returned a periodicity of 12.7 ± 0.1 d, implying a correlation with the photometric variability.
In Fig. 12 the strongest He I diffuse triplet transitions, shifted to their rest wavelength, are shown as a function of their phase, adopting the 12.7 d photometric period. It should be noted these features are susceptible to contamination by narrow nebular emission, which may not have been completely removed. However, variations in the P Cygni nature of their profiles are clearly visible. Hereafter we refer to these features as the “cool stellar” component.
3.4.3. Hot component
High-ionisation absorption lines were also identified in the spectrum, viz. Si iii, Si iv and N iii features as well the strongest He ii transition in this wavelength region, 4686 Å. The Si iv and N iii features were observed in the multi-epoch LR02 data, which reveal large RV variations with a range of ~260 km s-1. Including the LR03 observation (which includes the He ii, and Si iii lines) this range increases to ~420 km s-1. The weaker component of the He i spectrum (discussed in the previous section) has a similar velocity structure to these high-ionisation metal lines. Additionally, the N ii spectrum from the LR03 observation also displays a two component structure, with the RV estimate of one component compatible with those of the other high-ionisation features. Although the weaker He i component appears to have a similar RV variation to those of the high-ionisation metal lines, it is normally blended. Hence, the velocity range was determined only from the metal lines. Assuming that these lines all originate from a single stellar object, it would have an early-B/late-O spectral classification.
In Fig. 13 the RV estimates from the high-ionisation features are folded with the 12.7 d period found from the OGLE-III data. Also shown are the OGLE-III data for the block that overlapped in time with most of the FLAMES spectroscopy. From the figure the RV data appear to be consistent with the variations in magnitude and, although there are insufficient points to obtain an accurate period, a Lomb-Scargle periodogram returns a period of 10.5 ± 0.1 d, which appears roughly consistent with the photometry.
A detailed list of the absorption and emission features for VFTS698 are presented in Table 8 (available online). Values for the central wavelengths (corrected for the RV estimated from the iron-group spectra), equivalent widths, and full-width half-maxima of the profiles are provided. For spectral lines observed with the LR02 setting, these measurements are from the first epoch.
3.5. Projected rotational velocities
Assuming that the hot and cool components originate in stellar photospheres, we can attempt to estimate their projected rotational velocities. We have used a Fourier transform (FT) approach as discussed by Simón-Díaz & Herrero (2007), supplemented by fitting rotationally-broadened theoretical line profiles (PF) to the observed spectral features. For the latter we assumed that rotation dominated other broadening mechanisms and hence these are best considered as upper limits. Further details on the profile-fitting methodology can be found in Ryans et al. (2002).
For the hot component we used the Si iv lines at 4089 and 4116 Å and the N iii line at 4097 Å. For those LR02 epochs where the lines were discernible from features in the cool or circumstellar spectra, the data were shifted to a common rest frame and combined. This led to relatively clean profiles for the Si iv lines but the N iii line was still affected on its red wing by Hδ emission. The estimates are listed in Table 4 and are in reasonable agreement for both methodologies. Additionally, as expected, the PF estimates (which are upper limits) are generally larger than those from the FT approach. This provides indirect support for the validity of the latter. A simple average of the FT results leads to a value of 66 km s-1 for the hot component, with the spread of estimates and the upper limit from the PF estimates implying a conservative error bar of ±10 km s-1.
For the cool component, lines due to several metal species were identified. These suffered from blending with either the hot or circumstellar components. This was exacerbated by the features having a small RV variation and therefore not shifting with respect to the circumstellar features between epochs. Hence the stronger He i features were used, although their analysis is complicated by their greater intrinsic broadening. Additionally, several lines showed P Cygni profiles (see Sect. 3.4.2) and were not considered. The estimates are summarised in Table 4. They exhibit the expected systematic shift between the PF and FT approaches and lead to a mean FT estimate of 53 ± 10 km s-1 for the cool component; the error estimate again arises from the spread of values and the upper limit implied by the PF results.
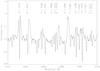 |
Fig. 11 Fe ii, Cr ii and Ti ii emission, and shell-like features from the (first epoch) LR02 spectrum of VFTS698. |
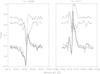 |
Fig. 12 The He i 4026 and 4471 Å normalised line profiles (left- and right-hand panels, respectively) shifted to their rest wavelengths, with their continuum level indicating their phase given a single 12.7 d period. The three epochs at a phase of 0.2 display similar structure, whereas later in the period (at phases of 0.6 and 0.8) there are significant changes in morphology. |
4. Atmospheric parameters
The complexity of the VFTS698 spectrum, containing several different components, makes any quantitative analysis both difficult and prone to systematic error. However the resulting quantitative information could be useful despite the large uncertainties. We have therefore attempted to obtain constraints on the effective temperature, surface gravity and nitrogen abundances for the two components using the non-LTE model atmosphere grid tlusty (Hubeny 1988); further details of the grids can be found in Ryans et al. (2003) and Dufton et al. (2005).
4.1. Hot component
The well-resolved spectral features of the hot stellar component made estimating its effective temperature from the Si iii/Si iv ionisation equilibrium relatively straightforward. Due to the strong Fe ii emission and absorption spectrum between 4500 and 4560 Å (shown in Fig. 10), as well as the wavelength cut-off at 4560 Å, the Si iii lines were not measurable in the LR02 setting. The longer wavelength coverage of the LR03 setting and the radial velocity of the hot component (>200 km s-1) in these data allowed equivalent-width measurements of Si iii 4567 Å for features that had a RV consistent with the hot and cool photospheric spectra. The equivalent widths of Si iv were taken from measurements of the 4089 and 4116 Å lines, in the LR02 data. The two Si iv lines displayed variations in intensity between epochs of 12% and 26%, respectively. The average equivalent widths for both Si iv lines gave an effective temperature estimate of ~27 000 K. However, the equivalent widths will be underestimated due to contributions from the other components in the spectrum. We assumed that this contribution was the same for all lines, which is not unreasonable given the relatively small wavelength separation. Then we investigated its effect on the effective temperature estimate by scaling the equivalent widths. Doubling the equivalent widths led to an increase in the estimate of 1000 K.
A lower limit to the effective temperature of the hot component was estimated from the He ii absorption line at 4686 Å. Rotationally-broadened profiles with a vsini of 70 km s-1 were generated from the tlusty grid of model atmospheres. From a χ2 fit an effective temperature of ~24 000 K was found together with a gravity, log g ~ 3.3. If the hot spectra contributed 50% of the continuum flux this estimate would be increased by 1500 K. The uncertainty in these estimates is difficult to judge. A lower limit of 24 000 K would appear reasonable both from the He ii spectrum and the presence of strong Si iv lines. An upper limit of 28 000 K is reasonable from the well observed Si iii. Hence we adopt 26 000 ± 2000 K, but acknowledge that there remains the possibility of additional systematic errors from our assumption of a classical non-LTE photospheric model.
4.2. Cool component
For the cool photospheric spectrum, the detection of Si ii and Si iii lines also allows the silicon ionisation balance to be used to estimate the effective temperature. Equivalent-width estimates were obtained for the Si ii 4128 and 4130 Å absorption lines from the LR02 data, and for Si iii at 4567 Å. Those for the former were difficult to estimate as the RVs were inconsistent within an epoch (see Table 3). This discrepancy is probably due to a weak emission feature around 4129 Å, and a Cr ii absorption component seen to be blended with the Si ii 4130 Å line. Assuming there is no flux contamination for the other spectral components, this leads to an effective temperature estimate of 17 800 K, for an assumed logarithmic gravity of log g = 3.0 based on other B-type supergiants taken from Hunter et al. (2008). Making similar assumptions as in the analysis of the hot component, i.e. doubling the equivalent widths, leads to an estimate of 18 400 K. Again the uncertainty is difficult to estimate. However, the clear presence of both ionisation states would imply that, excluding unknown systematic errors, an error of ± 2000 K would appear to be appropriate and therefore we adopt a Teff of 18 000 ± 2000 K.
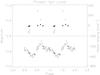 |
Fig. 13 Upper panel: radial velocities of the hot and cool components (open and solid circles, respectively) folded with a 12.7 d period. Lower panel: single block of phased OGLE-III data. The radial velocity measurements for the hot component appear to be consistent with the periodicity of the photometric data. |
Radial velocity measurements of absorption features for selected transitions for both hot and cool components.
Estimates of the projected rotational velocity (vsini) of the cool and hot components from the profile fitting (PF) and Fourier transform (FT) methods.
Apart from a weak constraint from the profile fitting of the He ii line, it was not possible to estimate the surface gravity of either components due to the strong emission in the Balmer lines.
In Sect. 3.3 a limit was placed on the luminosity of VFTS698 assuming it to be a single source. However, informed by the estimates of effective temperature further constraints could be placed on each of the components. Both the hot and cool spectra appear to be prominent, hence their contribution to the overall spectrum is thought to be comparable. Based on the effective temperature estimates from Table 6 we deduce luminosities for the hot and cool components of log L/L⊙ = 5.3 and 5.0, respectively, using bolometric corrections from (Crowther et al. 2006) and identical absolute visual magnitudes. To consider these components as main sequence objects would lead to a mass ratio estimate of ~2, but given our analysis of the VFTS698 system classifies it as a sgB[e] system this consideration is not applicable.
4.3. Nitrogen abundance estimates
The photospheric abundance of nitrogen is important for constraining the amount of nucleosynthetically-processed material present in a stellar atmosphere (Heger & Langer 2000; Przybilla et al. 2010; Brott et al. 2011). As N ii lines from both stellar components could be identified in the spectra, we can set lower limits on their nitrogen abundances.
For the hot component, adopting an effective temperature of 26 000 K, a gravity of log g = 3.3 and a microturbulence of 10 km s-1 leads to an estimate of ~7.3 dex from three N ii lines at 4600 Å. Note that adopting quantities for the gravity and microturbulence that would be expected for a star on the main sequence results in an effective temperature estimate of 30 000 K and a surface nitrogen abundance of ~8.0 dex. These weaker transitions were initially chosen because of their large velocity separation. The stronger N ii line at 3995 Å was identified in all the LR02 epochs, but the blending of the two stellar signatures made it difficult to disentangle the equivalent width estimates. Following a similar procedure to that used in measuring the RVs of the He i profiles, two-component Gaussian fits were employed, with the equivalent width of the hot component taken to be that with a RV component corresponding to the higher-excitation metal lines. Although there was a variation of the line strength between epochs, a mean value of 50 mÅ implied a nitrogen abundance of 7.2 dex using the same atmospheric parameters.
The above analysis assumes that all the continuum flux arises from the hot photospheric spectrum and therefore abundances were also estimated assuming 50 and 25% of the flux came from the hot component, as summarised in Table 5. The fact that both spectra are clearly visible would suggest each component might contribute ~50% to the total flux, which would then suggest a nitrogen abundance of 8.0 dex for the hot component. However, regardless of the flux contribution, there would appear to be an enrichment of nitrogen as, at the limit of a 100% contribution, the estimates show a 0.6 dex enhancement.
The same methodology has been used to estimate a nitrogen abundance for the cool spectral features although in some cases the equivalent-width measurements lay outside the theoretical grid at the 25% flux level. The equivalent-width estimates of the 3995 Å line were found to vary more between epochs than for the hot spectra but, if we adopt the average value, we estimate the lower limit to the nitrogen abundance as 7.9 dex, i.e. an enrichment of 1 dex. Adopting a 50% flux contribution leads to an estimate of ~8.6 dex.
Equivalent width (EW) measurements (quoted in mÅ) and abundance estimates for both N ii components.
Adopting a 50% flux contribution from the hot and cool components leads to silicon abundances between 7.0 and 7.2 dex which are in good agreement with those found for early-type stars in the LMC (see, e.g., Hunter et al. 2008), providing some indirect support for the methodology adopted. However we stress that the estimates of the atmospheric parameters and nitrogen abundances should be treated with caution because of the complexity of the VFTS698 spectra. In order to discuss the evolutionary status of VFTS698 in the following sections, we provide a summary table of the estimated properties of both hot and cool spectra in Table 6.
Summary of derived parameters for the VFTS698 system, assuming 50% of the flux comes from each component.
5. Discussion
The rich emission-line spectrum of VFTS698, dominated by H i, Fe ii and [Fe ii], is characteristic of stars demonstrating the B[e] phenomenon. Lamers et al. (1998) describe this behaviour as being present at a number of evolutionary stages in the life-cycle of both high- and low-mass single stars and binaries; essentially corresponding to the presence of a rich, density-stratified dusty and gaseous circumstellar environment, excited by a hot ionising source. We now discuss the nature of the circumstellar environment and that of the central “engine” of VFTS698 from the observational properties described in Sect. 3.
5.1. Circumstellar material
The differing line profiles of both the Fe ii and [Fe ii] transitions (e.g., Fig. 10) imply that they arise in kinematically distinct, gaseous regions of the circumstellar environment. Indeed, by analogy to classical Be stars, the shell profiles of the Fe ii transitions – characterised by deep central absorption troughs – suggest absorption in a flattened circumstellar disc or torus seen close to edge on. This is also analogous to the P Cygni profiles that arise in a spherically expanding envelope (e.g. Dachs et al. 1992). Following from this, the bona fide P Cygni profiles observed in e.g. the He i 4026 Å transition suggest a spherical outflow from the system. Such hybrid behaviour is common amongst sgB[e] stars, where it is often interpreted as resulting from a “composite” wind consisting of a dense, outflowing circumstellar disc and a high-velocity polar wind (e.g. Zickgraf et al. 1985).
However, as demonstrated clearly by Figs. 6 and 7, the IR properties of VFTS698 differ from those of bona fide sgB[e] stars. Kastner et al. (2006, 2010) showed that the IR emission from these stars is consistent with a population of warm grains located within a circumstellar disc with an inner gap resulting in a deficiency of hot dust. Upon consideration of the dust chemistry they further speculated that these are long-lived quasi-Keplerian discs, with material deposited from a previous red supergiant phase. By analogy to similar structures associated with post-AGB binary stars, it is possible that these discs are in fact circumbinary with an (unseen) companion responsible for the disc truncation. In contrast, VFTS698 does not appear to support large quantities of cool dust, although the presence of an apparent near-IR continuum excess raises the possibility of the presence of hot dust; detailed modelling will be required to characterise the nature of this excess, given that we would also expect a significant free-free emission from the gaseous component of the circumstellar environment.
5.2. Photospheric sources
We next turn to the central, exciting star(s) of VFTS698. Lamers et al. (1998) summarised the stellar properties of a representative sample of Magellanic Cloud sgB[e] stars, from investigations by Zickgraf et al. (1986) and Gummersbach et al. (1995). The temperatures of both our putative hot and cool components (Table 6) are consistent with these values, although the luminosities we infer are, for the most part, towards the lower range demonstrated (cf. Sect. 4), with 5.3 and 5.0 dex for the hot and cool components, respectively. The luminosity and effective temperature estimates of VFTS698 and other B[e] and B-type supergiants are illustrated on the Hertzsprung-Russell (H–R) diagram shown in Fig. 14. For the majority of B[e] objects it is evident that both components of VFTS698 appear at the lower luminosity end, but are brighter than the majority of B-type supergiants. The evolutionary nature of these lower luminosity (and mass) B[e] stars is uncertain (e.g. Gummersbach et al. 1995) but we note that this phenomenon is not uncommon or confined solely to the Magellanic Clouds, with a population also identified within M 33 (Clark et al. 2012).
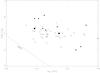 |
Fig. 14 Hertzsprung-Russell diagram comparing the two components of VFTS698 (solid squares) with B-type supergiants (open circles) from Hunter et al. (2008) and sgB[e] stars (solid circles) from Lamers et al. (1998). |
A key observational constraint placed on the stellar component(s) of VFTS698 is the presence of pronounced spectroscopic and photometric variability. The presence of variability of the Si iv lines echoes the findings of Zickgraf et al. (1986), who detected Si iv 4089 and 4116 Å absorption in the spectrum of Hen S22 where previously Muratorio (1978) observed no such features (although the source of this variation remains unclear). More telling is the presence of RV shifts in lines associated with both hot and cool components. Such behaviour is characteristic of both stellar pulsations and binary motion, although the magnitude of the RV changes in the hot component is significantly greater than expected from pulsations alone (Clark et al. 2010, 2012). Indeed, with two plasmas with significantly different temperatures (supported by the wide range of ionisation states observed, e.g., Si ii/Si iii/Si iv and N ii/N iii), with very distinct RV behaviours, it is highly plausible that VFTS698 is a hierarchical stellar system.
The multi-year photometric dataset strongly supports such an assertion, revealing a persistent 12.7 d periodicity superimposed over a long-term variation for a duration of 8 years (Sect. 3.1). While pulsationally-induced photometric variability appears ubiquitous across the upper reaches of the H–R diagram (e.g. Clark et al. 2012) the pulsations observed in the so-called supergiant α Cygni variables do not replicate the strict periodicity observed in VFTS698 over the 8 year observational period. Specifically, we may contrast this behaviour to that of the Galactic B[e] star GG Car, which Gosset et al. (1984) showed to have a photometric period of 31.02 d, with an amplitude of ~0.5 mag that is stable over a 4 year period. Subsequent spectroscopic observations (Gosset et al. 1985) revealed correlated RV changes suggesting a binary nature for this system. Unfortunately, with only six epochs of LR02 spectroscopy for VFTS698, we are unable to determine accurate periodicities, although, for completeness, we note that the RV variations were found in Sect. 3.4 to be reasonably compatible with the 12.7 d photometric period.
5.3. Interacting binary
Under the assumption of binarity, what may we conclude about the properties of the VFTS698 system? Its photometric properties suggest obvious similarities with the class of DPVs identified by Mennickent et al. (2003) from OGLE-II data. These intrinsically blue objects demonstrate both short-(P1, days) and long-term periodicities (P2, hundreds of days). Mennickent et al. suggested that these are related to the orbital period and precession of an elliptical accretion disc and/or episodic mass loss, respectively, within a semi-detached binary system5. As such they would be closely related in evolutionary terms to the better documented W Serpentis/β Lyrae binaries in the Galaxy (e.g. Tarasov 2000, and references therein). In these short-period6, interacting systems the mass loss from the initially more massive component results in the formation of an accretion disc/torus (which veils the mass gainer) and in the reversal of the mass ratio of the system. A consequence of this configuration is the presence of photometric modulation on the time-scale of the orbital period, as well as binary RV variability in the spectrum of the primary. Binary motion is also visible in the spectroscopic signature of the accretion disc around the mass gainer in the subset of systems where it may be isolated (cf. Tarasov 2000), while some systems also demonstrate long term, aperiodic, photometric variability (e.g. Strupat 1987). Finally, the mass transfer drives a complex circumstellar environment, with evidence for both polar mass-loss (e.g. β Lyrae; Harmanec et al. 1996) and the presence of a circumbinary disc (e.g. BY Cru; Tarasov 2000) in some systems. While the presence of P Cygni profiles in selected He i transitions of VFTS698 is suggestive of the former, the lack of RV variability in the Fe ii/[Fe ii] emission-line spectrum argues for dynamical decoupling of the material from which it originates.
Since VFTS698 appears to demonstrate the majority of the physical phenomena associated with W Serpentis-type, semi-detached eclipsing binaries, we consider such an identification as highly promising. A particularly interesting comparator is the massive (~7 M⊙+30 M⊙) binary RY Scuti, due to the similar orbital period (~11 d modulation present in both photometry and spectroscopy) and spectral type of the mass donor/secondary (O9.7 Ibpe; Walborn 1982) compared to the hot component in VFTS698 and presence of circumbinary ejecta. Although the primary/mass gainer in RY Scuti is enshrouded by circumstellar material, using tomographic reconstruction Grundstrom et al. (2007) estimated a B0.5 I classification for the “massive companion” but suggest that the latter is actually the spectrum of the photosphere due to an accretion torus directly associated with it. The RV estimates for the hot component of RY Scuti were found using high-ionisation metal lines (Si iv and N iii), whereas the wings of Hα, He ii 4686 Å emission, and Si iii absorption were the only features capable of reproducing the anti-phase for the cool component. Unfortunately, due to the singular LR03 and HR15N observations for VFTS698, an equivalent RV analysis is not possible. Furthermore, as discussed in Sect. 4, Si iii was detected for the cool component but because of rich Fe ii emission around 4550 Å, multi-epoch data of this ionisation state was unavailable. Nevertheless, by analogy to RY Scuti it might be supposed that the spectroscopic features of the cool companion in VFTS698 actually arise in the photosphere of an accretion disc/torus around the veiled mass gainer. In such a scenario one would anticipate that RV changes be anti-correlated with those observed in the hot component, an effect that does not appear to be present in our limited dataset. However, we note that if the spectrum of the cool component was formed at the L1 Lagrange point (where Roche lobe overflow will occur – presumably as the material will be at its most dense there), then this would lie inside the centre of mass of the system, and so we would expect to see a weak correlation between the hot and cool component spectra, as is observed.
Comparison of orbital and stellar parameters of VFTS698 derived here with those for known sgB[e] stars and interacting binary systems.
Further RV observations of VFTS698 are required to investigate this discrepancy. If confirmed, one possible explanation might be the presence of a third body in the system, although in this case one would expect a significantly longer period than the provisional ~ 12.7 ± 0.1 d period determined from the current dataset. Moreover, in comparison to RY Scuti, the richer Fe ii/[Fe ii] emission-line spectrum suggests differences in the geometry/composition of the circumstellar/binary envelope.
Although no B[e] phenomena has been detected in the comparison interacting binaries7, it’s suggested the SMC sgB[e] R4 is a binary merger, the product of a close binary interaction (Zickgraf et al. 1996; Podsiadlowski et al. 2006). Langer & Heger (1998) have attempted to explain this evolutionary scenario by the following binary interaction. When the primary evolves and fills its Roche lobe, accreting matter to the secondary, if the accretion time-scale, τṀ = M/Ṁ, is shorter than the thermal time-scale of the secondary, τKH = GM2/(RL), both components can fill their Roche lobes, resulting in a contact binary and L2 Roche-lobe overflow. The material passing through the L2 Lagrangian point, will remove angular momentum from the system, forming a disk-like structure around what will become a merger remnant of an interacting binary. This would imply that VFTS698 and R4 are in respectively a pre- and post-merger evolutionary state. However the alternative scenario sees the loss of angular momentum slow the system down enough to prevent a binary merger as the initially more massive companion will explode as a type Ib/c supernova. The result sees the mass donor slim down to a Wolf-Rayet star, leaving a short-period binary system as found by Clark et al. (2011) in Westerlund 1 (further details can be found in Ritchie et al. 2012).
In Sect. 4.3 the nitrogen abundances were investigated assuming each component to be that of a stellar photosphere. However, in view of the above scenario, it is difficult to ascertain what constraints can be placed on the analysis of nitrogen abundances. For the hot component, our nitrogen abundance estimate of 8.0 dex still appears to be a reasonable result given the assumptions made for surface gravity and microturbulence. Considering the cool component is thought to originate from an optically thick disc, our assumption of a supergiant surface gravity can no longer be applied, and hence it is unclear what conclusions we can draw on the parameters of the pseudo-photosphere other than there is evidence for a temperature consistent with a mid-B type photosphere, with spectral evidence for a large nitrogen enrichment.
6. Conclusions
A detailed spectroscopic and photometric study of VFTS698 has been presented to ascertain its evolutionary status. In summary, VFTS698, shows evidence for being a double-lined spectroscopic binary, consisting of early- and mid-B type components. The spectrum is rich with iron-group emission and absorption features which appear synonymous with the B[e] phenomenon (e.g., Lamers et al. 1998). OGLE-III photometry shows a stable 12.7 d period from 8 years of observations, and IRSF and Spitzer imaging shows VFTS698 to have strong near- and mid-IR excesses. We present the scenario for a W Serpentis-type interacting binary based on the following attributes:
-
1
The near- and mid-IR excess of VFTS698 appears different tothat observed in bona fide sgB[e] stars;
-
2
The stable 12.7 d photometric period is consistent with both the orbital motion and short-term orbital periods of W Serpentis-like objects. RVs of both components appear consistent with this short-period orbit;
-
3
There is evidence for long-term photometric variations, a defining characteristic for this class of binaries (Strupat 1987);
-
4
A complex circumstellar structure is inferred from the time-variable emission lines which display diverse morphologies, e.g., P Cygni He i profiles, and shell-like Fe II lines, similar to those in β Lyrae (see Tarasov 2000).
The following points require contemporaneous photometry and spectroscopy, together with detailed modelling in order to better ascertain the exact nature of the VFTS698 system.
-
1
The near- and mid-IR excess, iron-group shell spectra, and PCygni structure in the helium spectra are indicators for a complexcircumstellar geometry consisting of circumbinary material, acircumstellar disc and wind outflows.
-
2
The RV measurements of the primary/circumstellar disc appear inconsistent with an anti-correlation which would be expected for a binary system.
Through the course of this investigation, a number of different comparison objects (see Table 7) have been used to conclude that VFTS698 is an interacting binary, comprising a visible, hot secondary in orbit with a veiled, cool, massive primary. We surmise the spectral component associated with the primary to originate from the circumstellar disc, but require more detailed RV measurements and contemporary photometry to support this argument.
Online material
Line identifications for the three plasma components of the VFTS698 system.
Lamers et al. (1998) listed 11 B[e] supergiants in the LMC, later revised to 10 by Bonanos et al. (2009).
We note that the source of such excesses in the near-IR for LBVs may also be small ejecta nebulae surrounding the star (Bonanos et al. 2009).
Mennickent et al. relate the periodicities in DPVs by P1 = 35.2 ± 0.8 P2; later revised by Mennickent & Kolaczkowski (2009) to ~33. From our period search of VFTS698 (Sect. 3.1) we find a 12.7 d period, and some evidence for a 400 d period, leading to a ratio of ~31.
E.g.: β Lyrae (12.9 d), W Serpentis (14.16 d), V367 Cyg (18.16 d), from Tarasov (2000).
A possible exception being the SMC star N 82, which Heydari-Malayeri (1990) determined to be a sgB[e], but this classification was weakend by the investigation of Mennickent & Smith (2010) from an interacting binary nature.
Acknowledgments
We would like to thank Alceste Bonanos for discussions regarding the periodicity of the OGLE data. We thank Vanessa Stroud and the Faulkes Telescope Project for use of the FTS observations. Thanks to Otmar Stahl for supplying the B[e] comparison spectra. We are grateful to Selma de Mink, Norbert Langer, Myron Smith, Nolan Walborn and Christopher Watson who have offered their time in detailed discussions on the binary nature of VFTS698. Thanks to the Spitzer SAGE and IRSF surveys and the Chandra data archive. PRD would like to acknowledge financial support from the UK Science and Technology Facilities Council and the Department of Education and Learning in Northern Ireland.
References
- Alves, D. R. 2004, New Astron. Rev., 48, 659 [NASA ADS] [CrossRef] [Google Scholar]
- Bonanos, A. Z., Massa, D. L., Sewilo, M., et al. 2009, AJ, 138, 1003 [NASA ADS] [CrossRef] [Google Scholar]
- Bosch, G., Terlevich, R., Melnick, J., & Selman, F. 1999, A&AS, 137, 21 [NASA ADS] [CrossRef] [EDP Sciences] [Google Scholar]
- Brott, I., de Mink, S. E., Cantiello, M., et al. 2011, A&A, 530, A115 [NASA ADS] [CrossRef] [EDP Sciences] [Google Scholar]
- Clark, J. S., Castro, N., Garcia, M., et al. 2012, A&A, 541, A146 [NASA ADS] [CrossRef] [EDP Sciences] [Google Scholar]
- Clark, J. S., Ritchie, B. W., & Negueruela, I. 2010, A&A, 514, A87 [NASA ADS] [CrossRef] [EDP Sciences] [Google Scholar]
- Clark, J. S., Ritchie, B. W., Negueruela, I., et al. 2011, A&A, 531, A28 [NASA ADS] [CrossRef] [EDP Sciences] [Google Scholar]
- Crowther, P. A., Lennon, D. J., & Walborn, N. R. 2006, A&A, 446, 279 [NASA ADS] [CrossRef] [EDP Sciences] [Google Scholar]
- Dachs, J., Hummel, W., & Hanuschik, R. W. 1992, A&AS, 95, 437 [NASA ADS] [Google Scholar]
- De Greve, J. P., & Linnell, A. P. 1994, A&A, 291, 786 [NASA ADS] [Google Scholar]
- Dufton, P. L., Ryans, R. S. I., Trundle, C., et al. 2005, A&A, 434, 1125 [NASA ADS] [CrossRef] [EDP Sciences] [Google Scholar]
- Evans, C. J., Taylor, W. D., Hénault-Brunet, V., et al. 2011, A&A, 530, A108 [NASA ADS] [CrossRef] [EDP Sciences] [Google Scholar]
- Gosset, E., Surdej, J., & Swings, J. P. 1984, A&AS, 55, 411 [NASA ADS] [Google Scholar]
- Gosset, E., Hutsemekers, D., Swings, J. P., & Surdej, J. 1985, A&A, 153, 71 [NASA ADS] [Google Scholar]
- Grundstrom, E. D., Gies, D. R., Hillwig, T. C., et al. 2007, ApJ, 667, 505 [NASA ADS] [CrossRef] [Google Scholar]
- Gummersbach, C. A., Zickgraf, F.-J., & Wolf, B. 1995, A&A, 302, 409 [NASA ADS] [Google Scholar]
- Harmanec, P., Morand, F., Bonneau, D., et al. 1996, A&A, 312, 879 [NASA ADS] [Google Scholar]
- Heger, A., & Langer, N. 2000, ApJ, 544, 1016 [NASA ADS] [CrossRef] [Google Scholar]
- Herrero, A., Garcia, M., Uytterhoeven, K., et al. 2010, A&A, 513, A70 [NASA ADS] [CrossRef] [EDP Sciences] [Google Scholar]
- Heydari-Malayeri, M. 1990, A&A, 234, 233 [NASA ADS] [Google Scholar]
- Hubeny, I. 1988, Comput. Phys. Comm., 52, 103 [Google Scholar]
- Hunter, I., Lennon, D. J., Dufton, P. L., et al. 2008, A&A, 479, 541 [NASA ADS] [CrossRef] [EDP Sciences] [Google Scholar]
- Kastner, J. H., Buchanan, C. L., Sargent, B., & Forrest, W. J. 2006, ApJ, 638, L29 [NASA ADS] [CrossRef] [Google Scholar]
- Kastner, J. H., Buchanan, C., Sahai, R., Forrest, W. J., & Sargent, B. A. 2010, AJ, 139, 1993 [NASA ADS] [CrossRef] [Google Scholar]
- Kato, D., Nagashima, C., Nagayama, T., et al. 2007, PASJ, 59, 615 [NASA ADS] [Google Scholar]
- Lamers, H. J. G. L. M., Zickgraf, F.-J., de Winter, D., Houziaux, L., & Zorec, J. 1998, A&A, 340, 117 [NASA ADS] [Google Scholar]
- Langer, N., & Heger, A. 1998, in B[e] stars, ed. A. M. Hubert, & C. Jaschek, Astrophysics and Space Science Library, 233, 235 [Google Scholar]
- Levesque, E. M., Massey, P., Olsen, K. A. G., et al. 2005, ApJ, 628, 973 [NASA ADS] [CrossRef] [Google Scholar]
- Massey, P. 2003, ARA&A, 41, 15 [NASA ADS] [CrossRef] [Google Scholar]
- Massey, P., Zangari, A. M., Morrell, N. I., et al. 2009, ApJ, 692, 618 [NASA ADS] [CrossRef] [Google Scholar]
- Meixner, M., Gordon, K. D., Indebetouw, R., et al. 2006, AJ, 132, 2268 [NASA ADS] [CrossRef] [Google Scholar]
- Melnick, J. 1985, A&A, 153, 235 [NASA ADS] [Google Scholar]
- Mennickent, R., & Kolaczkowski, Z. 2009 [Google Scholar]
- Mennickent, R. E., & Smith, M. A. 2010, MNRAS, 407, 734 [NASA ADS] [CrossRef] [Google Scholar]
- Mennickent, R. E., Pietrzyński, G., Diaz, M., & Gieren, W. 2003, A&A, 399, L47 [NASA ADS] [CrossRef] [EDP Sciences] [Google Scholar]
- Men’shchikov, A. B., & Miroshnichenko, A. S. 2005, A&A, 443, 211 [NASA ADS] [CrossRef] [EDP Sciences] [Google Scholar]
- Muratorio, G. 1978, A&AS, 33, 125 [NASA ADS] [Google Scholar]
- Parker, J. W. 1993, AJ, 106, 560 [NASA ADS] [CrossRef] [Google Scholar]
- Plavec, M. J., Popper, D. M., & Ulrich, R. K. 1980, Nature, 287, 373 [NASA ADS] [CrossRef] [Google Scholar]
- Podsiadlowski, P., Morris, T. S., & Ivanova, N. 2006, inStars with the B[e] Phenomenon, ed. M. Kraus, & A. S. Miroshnichenko (San Francisco: ASP), ASP Conf. Ser., 355, 259 [Google Scholar]
- Przybilla, N., Firnstein, M., Nieva, M. F., Meynet, G., & Maeder, A. 2010, A&A, 517, A38 [NASA ADS] [CrossRef] [EDP Sciences] [Google Scholar]
- Ritchie, B. W., Stroud, V. E., Evans, C. J., et al. 2012, A&A, 537, A29 [NASA ADS] [CrossRef] [EDP Sciences] [Google Scholar]
- Ryans, R. S. I., Dufton, P. L., Rolleston, W. R. J., et al. 2002, MNRAS, 336, 577 [NASA ADS] [CrossRef] [Google Scholar]
- Ryans, R. S. I., Dufton, P. L., Mooney, C. J., et al. 2003, A&A, 401, 1119 [NASA ADS] [CrossRef] [EDP Sciences] [Google Scholar]
- Salpeter, E. E. 1955, ApJ, 121, 161 [Google Scholar]
- Selman, F., Melnick, J., Bosch, G., & Terlevich, R. 1999, A&A, 341, 98 [NASA ADS] [Google Scholar]
- Simón-Díaz, S., & Herrero, A. 2007, A&A, 468, 1063 [NASA ADS] [CrossRef] [EDP Sciences] [Google Scholar]
- Smartt, S. J. 2009, ARA&A, 47, 63 [NASA ADS] [CrossRef] [Google Scholar]
- Strupat, W. 1987, A&A, 185, 150 [NASA ADS] [Google Scholar]
- Tarasov, A. E. 2000, in IAU Colloq. 175: The Be Phenomenon in Early-Type Stars, ed. M. A. Smith, H. F. Henrichs, & J. Fabregat (San Francisco: ASP), ASP Conf. Ser., 214, 644 [Google Scholar]
- Townsley, L. K., Broos, P. S., Feigelson, E. D., Garmire, G. P., & Getman, K. V. 2006, AJ, 131, 2164 [NASA ADS] [CrossRef] [Google Scholar]
- Udalski, A. 2003, Acta Astron., 53, 291 [NASA ADS] [Google Scholar]
- Udalski, A., Szymanski, M. K., Soszynski, I., & Poleski, R. 2008, Acta Astron., 58, 69 [NASA ADS] [Google Scholar]
- van Genderen, A. M., & Thé, P. S. 1984, Space Sci. Rev., 39, 317 [Google Scholar]
- Walborn, N. R. 1982, AJ, 87, 1300 [NASA ADS] [CrossRef] [Google Scholar]
- Walborn, N. R., & Blades, J. C. 1997, ApJS, 112, 457 [NASA ADS] [CrossRef] [Google Scholar]
- Zickgraf, F.-J., Wolf, B., Stahl, O., Leitherer, C., & Klare, G. 1985, A&A, 143, 421 [NASA ADS] [Google Scholar]
- Zickgraf, F.-J., Wolf, B., Leitherer, C., Appenzeller, I., & Stahl, O. 1986, A&A, 163, 119 [NASA ADS] [Google Scholar]
- Zickgraf, F.-J., Kovacs, J., Wolf, B., et al. 1996, A&A, 309, 505 [NASA ADS] [Google Scholar]
All Tables
Photometry of VFTS698 and four nearby, early B-type (or late O) VFTS sources with comparable V-band magnitudes.
Radial velocity measurements of absorption features for selected transitions for both hot and cool components.
Estimates of the projected rotational velocity (vsini) of the cool and hot components from the profile fitting (PF) and Fourier transform (FT) methods.
Equivalent width (EW) measurements (quoted in mÅ) and abundance estimates for both N ii components.
Summary of derived parameters for the VFTS698 system, assuming 50% of the flux comes from each component.
Comparison of orbital and stellar parameters of VFTS698 derived here with those for known sgB[e] stars and interacting binary systems.
All Figures
|
Fig. 1 I-band light-curve of OGLE-III data from 8 years of observations. VFTS698 shows a short-term variation of ~0.2 mag, increasing up to ~0.5 mag with time. Solid circles and squares show the mean and median values, respectively, for each block. The typical uncertainty associated with the OGLE-III data is ± 0.015 mag, as illustrated in the upper left of the figure. |
| In the text | |
|
Fig. 2 Merged Chandra image (smoothed for legibility) of the region surrounding VFTS698 (marked by the white crosshairs). |
| In the text | |
|
Fig. 3 OGLE-III I-band photometry of VFTS698 folded with a 12.7 d period. Left-hand panel: first four blocks of observations; right-hand panel: blocks five to eight. For clarity two periods have been plotted for each observation block. |
| In the text | |
|
Fig. 4 Left-hand panel: I-band OGLE-III photometry of VFTS698 folded to a 400 d period. Right-hand panel: the median magnitude and date for each block of OGLE-III I-band data as a function of phase. The bar indicates the typical phase coverage by each block. |
| In the text | |
|
Fig. 5 Upper panel: differential V-band photometry of VFTS698 from 11 months of FTS observations (open circles). Mean and median magnitudes for the two seasons are indicated by solid circles and squares, respectively. Lower panel: FTS photometry folded to a 12.7 d period. |
| In the text | |
|
Fig. 6 J − Ks colour vs. Ks − [8.0] colour for VFTS698, other emission-line objects and OBA-type supergiants in the LMC. The recently discovered B[e] star VFTS1003 is also shown for comparison. Note that strong emission lines are also expected to contribute to the near-IR continuum emission of WC stars. |
| In the text | |
|
Fig. 7 Mid-IR colours for VFTS698, other emission-line objects and OBA-type supergiants in the LMC. VFTS698 appears to have an IR-excess greater than normal OBA supergiants, but not to the same extent as other sgB[e] stars. |
| In the text | |
|
Fig. 8 Optical spectroscopy of the HR15N observations of VFTS698. See Fig. 10 for details on the LR02 and LR03 settings. |
| In the text | |
|
Fig. 9 Example RV variations displayed by helium and metal lines. Fitted Gaussian profiles are over-plotted and rest wavelengths are indicated by the vertical dashed lines. Left-hand panel: He i 4437 Å, in which the “hot”, second component is noted by the marks above the continuum. Right-hand panel: Si iv 4089 Å and N iii 4097 Å. |
| In the text | |
|
Fig. 10 The combined LR02 and LR03 spectra of VFTS698 (lower spectrum), compared with two sgB[e] stars in the SMC: R50 (upper spectrum, from Zickgraf et al. 1986) and R4 (middle spectrum, from Zickgraf et al. 1996; Podsiadlowski et al. 2006). |
| In the text | |
|
Fig. 11 Fe ii, Cr ii and Ti ii emission, and shell-like features from the (first epoch) LR02 spectrum of VFTS698. |
| In the text | |
|
Fig. 12 The He i 4026 and 4471 Å normalised line profiles (left- and right-hand panels, respectively) shifted to their rest wavelengths, with their continuum level indicating their phase given a single 12.7 d period. The three epochs at a phase of 0.2 display similar structure, whereas later in the period (at phases of 0.6 and 0.8) there are significant changes in morphology. |
| In the text | |
|
Fig. 13 Upper panel: radial velocities of the hot and cool components (open and solid circles, respectively) folded with a 12.7 d period. Lower panel: single block of phased OGLE-III data. The radial velocity measurements for the hot component appear to be consistent with the periodicity of the photometric data. |
| In the text | |
|
Fig. 14 Hertzsprung-Russell diagram comparing the two components of VFTS698 (solid squares) with B-type supergiants (open circles) from Hunter et al. (2008) and sgB[e] stars (solid circles) from Lamers et al. (1998). |
| In the text | |
Current usage metrics show cumulative count of Article Views (full-text article views including HTML views, PDF and ePub downloads, according to the available data) and Abstracts Views on Vision4Press platform.
Data correspond to usage on the plateform after 2015. The current usage metrics is available 48-96 hours after online publication and is updated daily on week days.
Initial download of the metrics may take a while.