Free Access
Fig. 9
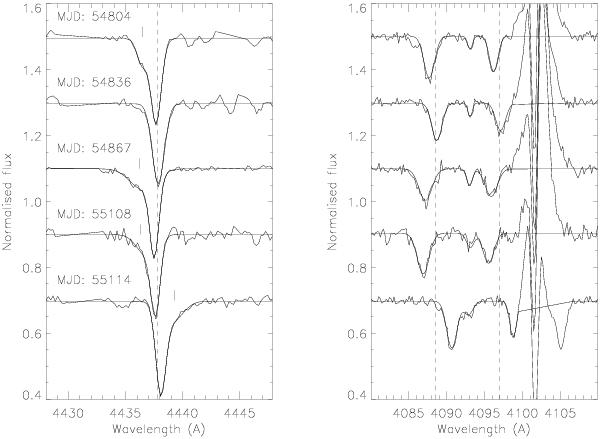
Example RV variations displayed by helium and metal lines. Fitted Gaussian profiles are over-plotted and rest wavelengths are indicated by the vertical dashed lines. Left-hand panel: He i 4437 Å, in which the “hot”, second component is noted by the marks above the continuum. Right-hand panel: Si iv 4089 Å and N iii 4097 Å.
Current usage metrics show cumulative count of Article Views (full-text article views including HTML views, PDF and ePub downloads, according to the available data) and Abstracts Views on Vision4Press platform.
Data correspond to usage on the plateform after 2015. The current usage metrics is available 48-96 hours after online publication and is updated daily on week days.
Initial download of the metrics may take a while.