Fig. 3
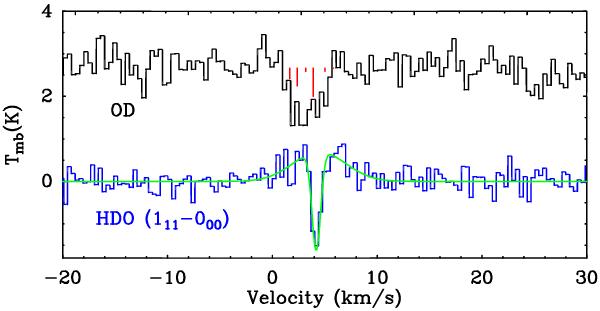
HDO 11,1–00,0 and OD line profiles observed towards IRAS 16293. The HDO spectrum was shifted by –2.9 K along the y-axis. The OD spectrum was smoothed to 0.39 km s-1. The hyperfine intensity structure of the OD line is shown as red bars. Note that the OD observation is DSB while the HDO observation is SSB. The green curve shows the two-Gaussian fit of the HDO profile (see Table 1).
Current usage metrics show cumulative count of Article Views (full-text article views including HTML views, PDF and ePub downloads, according to the available data) and Abstracts Views on Vision4Press platform.
Data correspond to usage on the plateform after 2015. The current usage metrics is available 48-96 hours after online publication and is updated daily on week days.
Initial download of the metrics may take a while.