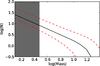
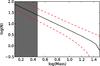
Fig. 12
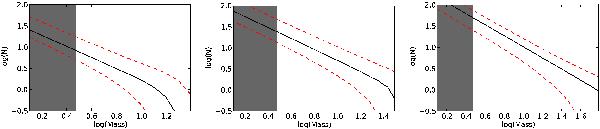
[From left to right] The expected number of observable stars associated with a 25, 40, and 100 M⊙ massive star in 420, 1000, and 4000 M⊙ clusters, respectively based on the 30 000 Monte Carlo simulation runs. The black solid lines are the mean number of stars per mass bin and the dashed red lines are the 1σ dispersion. Stars with masses below 3 M⊙ are greyed out on the left hand side of the plot, as those to the right of it are observable. The expected number of observable stars with a 1σ dispersion from the mean are 11, 53, and 148 assuming AV ~ 1. According to the estimated number of excess stars for the candidates (see Table 3) we should have detected such cluster presence around the 25 M⊙ candidates at minimum.
Current usage metrics show cumulative count of Article Views (full-text article views including HTML views, PDF and ePub downloads, according to the available data) and Abstracts Views on Vision4Press platform.
Data correspond to usage on the plateform after 2015. The current usage metrics is available 48-96 hours after online publication and is updated daily on week days.
Initial download of the metrics may take a while.