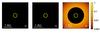
Fig. 3
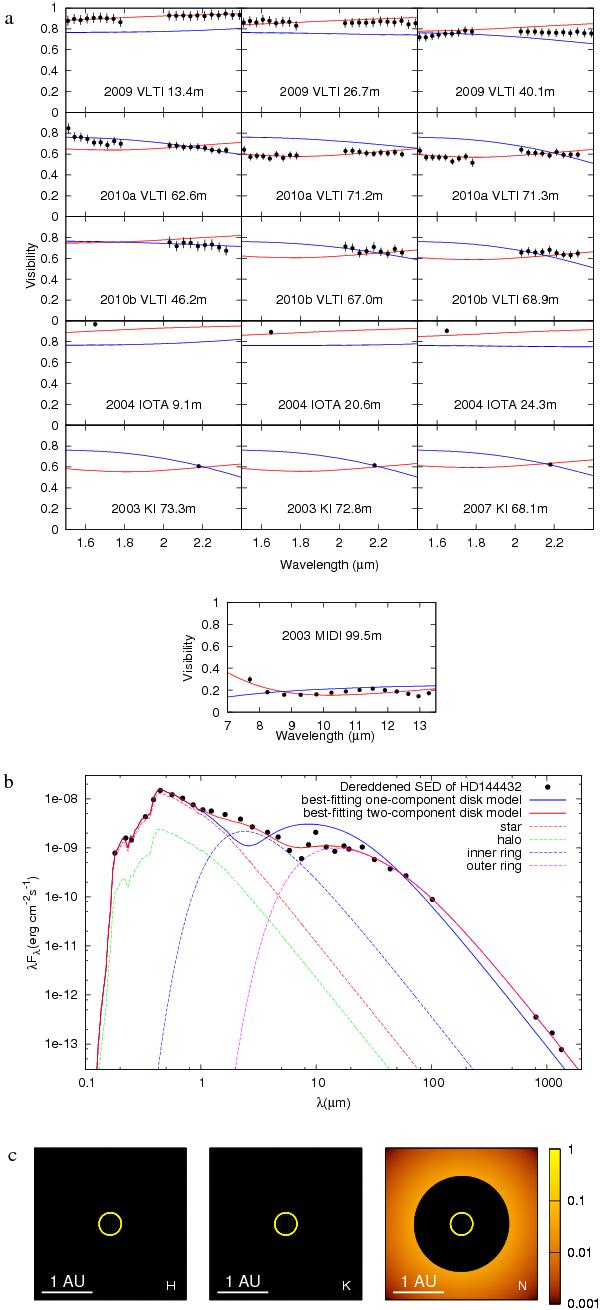
Comparison of the best-fit two-component disk model (red lines; see Table 3) and best-fit one-component disk model (blue lines) with the observations of HD 144432. a) Near- and mid-infrared visibilities. The data sets 2004 IOTA, 2003 KI, 2007 KI, and 2003 MIDI mentioned in the panels are taken from Monnier et al. (2006), Monnier et al. (2005), Eisner et al. (2009), and Leinert et al. (2004), respectively. b) SED (from Leinert et al. 2004) and temperature-gradient models. The dashed lines denote the contributions from individual components in the best-fit two-component disk model. c) H-, K-, and N-band intensity distributions of the best-fit two-component disk model (Table 3). The second component of the disk, i.e., the more extended part, is visible only in the N band. The star and halo are not plotted.
Current usage metrics show cumulative count of Article Views (full-text article views including HTML views, PDF and ePub downloads, according to the available data) and Abstracts Views on Vision4Press platform.
Data correspond to usage on the plateform after 2015. The current usage metrics is available 48-96 hours after online publication and is updated daily on week days.
Initial download of the metrics may take a while.