Fig. 1
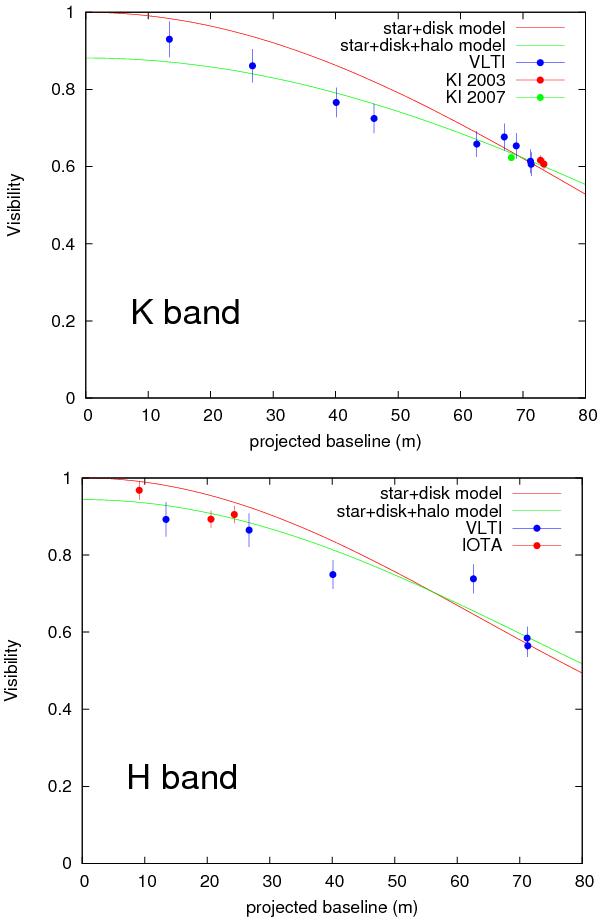
Band-averaged visibilities as a function of baseline length. The dots with errorbars are the observations (blue dots: our VLTI data; red and green dots: IOTA and KI data taken from Monnier et al. 2005, 2006; and Eisner et al. 2009). The lines are best-fit geometric models (inclination  , red: star-disk model; green: star-disk-halo model). Top panel: K band. Bottom panel: H band. Model parameters are listed in Table 3.
Current usage metrics show cumulative count of Article Views (full-text article views including HTML views, PDF and ePub downloads, according to the available data) and Abstracts Views on Vision4Press platform.
Data correspond to usage on the plateform after 2015. The current usage metrics is available 48-96 hours after online publication and is updated daily on week days.
Initial download of the metrics may take a while.