| Issue |
A&A
Volume 541, May 2012
|
|
|---|---|---|
| Article Number | A86 | |
| Number of page(s) | 6 | |
| Section | The Sun | |
| DOI | https://doi.org/10.1051/0004-6361/201218781 | |
| Published online | 04 May 2012 | |
Fragmentation during merging of plasmoids in the magnetic field reconnection
Astronomical Institute of the Academy of Sciences of the Czech
Republic,
25165
Ondřejov,
Czech Republic
e-mail: karlicky@asu.cas.cz
Received: 6 January 2012
Accepted: 28 March 2012
Context. Application of the magnetic-reconnection theory onto large-scale events, such as solar flares, requires formation of very thin (kinetic-scale) current sheets within the rather thick flare current layer. Hence, some fragmentation/filamentation mechanisms has to be in action.
Aims. We aim at identifying fragmentation mechanisms for magnetic field and current density structures. Namely, we focus at detailed study of the processes during the merging of plasmoids that had been formed in the current layer.
Methods. A 2.5-D electromagnetic particle-in-cell model is used and its results analysed.
Results. It is shown that the merging process of plasmoids is not a simple process as presented in some previous studies. On the contrary, this process leads to a complex fragmentation. We found two types of fragmentation processes: a) fragmentation in the current sheet generated between the merging plasmoids and b) fragmentation at the boundary of plasma outflow from the reconnection between these plasmoids. While the first type of fragmentation is generated by the tearing-mode (plasmoid) instability of the secondary current sheet, the second one looks to be connected with an increase of the plasma β parameter during these processes. Thus, sheared high-β plasma flows produce this additional fragmentation.
Conclusions. The fragmentation and energy transport from large to small scales in a large-scale magnetic reconnection seem to be the result of interplay and positive feedback between instabilities driven by high gradients in both magnetic (intense current density) and velocity (high vorticity) fields.
Key words: Sun: flares / magnetic reconnection
© ESO, 2012
1. Introduction
Magnetic field reconnection is generally accepted as the key mechanism for energy release in solar flares and other eruptive events in astrophysical and space plasmas. However, direct application of magnetic-reconnection theory to the physics of solar flares (and other large-scale events) faces a crucial problem for a long time: all known micro-physical processes leading to the change of magnetic field topology (i.e. the reconnection) require very thin current sheets (≈ 10 m in the solar corona), see e.g. Heyvaerts (1981); Büchner (2006). On the other hand, there are authors (Ko et al. 2003; Lin et al. 2005) considering the bright thin ray-like structures sometimes observed behind CMEs as current sheets. However, these structures are about six orders of magnitude thicker. This duality is reflected also in the solar-flare observations, which exhibit both coherent large-scale (107 m) dynamics and signatures of the micro-scale, chaotic energy release (e.g. the narrowband dm-spikes and lace bursts, Karlický 1984; Karlický et al. 2001), at the same moment.
For this reason, plasmoids, which are formed in a very broad range of scales in the current sheets, can play a very important role in bridging this huge scale gap (Shibata & Tanuma 2001). It is believed that they are generated by the tearing-mode instability (or, better, plasmoid instability Loureiro et al. 2007). In the “standard” CSHKP flare model (see, e.g., Magara et al. 1996, and references therein) it was proposed that these plasmoids are generated in the extended current sheet formed below the rising magnetic rope. For the first time, the plasmoids were recognized in soft X-ray observations during the 1992 October 5 flare by Ohyama & Shibata (1998). Later on, Kliem et al. (2000) showed that the plasmoids are associated with the drifting pulsating structures (DPSs) on radiowaves – see also Karlický et al. (2002), Karlický (2004), Karlický & Bárta (2007), Bárta et al. (2008a), and Karlický et al. (2010). In the vertical flare current sheet the plasmoids move upwards or downwards or even stay without any motion in dependence on a form of the surrounding magnetic field (Bárta et al. 2008b; Shen et al. 2011). Due to a preference of divergent magnetic field lines in the upwards direction, most of the plasmoids move upwards and corresponding DPSs drift towards lower frequencies. Nevertheless, in some cases the plasmoids move downwards and even interact with the underlying flare arcade as observed by Kołomański & Karlický (2007); Milligan et al. (2010).
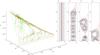 |
Fig. 1 Space-time trajectories of magnetic null points mapping the evolution of the magnetic field structure (left). The green dots represent the X-points, the red dots the O-points. Panels a)−d) show the global view on magnetic field lines and corresponding current densities (red-blue scale) in the x − y computational plane at four consecutive times: a) at t = 0, b) at t = 3000, c) at t = 5000, and d) at t = 8000. |
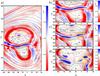 |
Fig. 2 Fragmentation of the current sheet between merging plasmoids (a.k.a. fragmenting coalescence, see Bárta et al. 2011; Karlický & Bárta 2011). Figure displays the current density jz-component (red-blue scale = negatively-positively oriented), magnetic field (black field lines), the lines of Bx = 0 and By = 0 (red and green lines, respectively), and the magnetic null points (X-points: cyan crosses, O-points: magenta squares). Panel a) shows a larger view on the merging of two plasmoids in time t = 6000. Panel b) displays the situation at the same time but zoomed to the area around the positive CS formed between the merging plasmoids. Panel c) shows formation of the new X-O pair around x = 0, y = 1350 (marked by the gold ellipse) in time t = 6150. Even further fragmentation in the already decaying CS between the plasmoids is seen at t = 6700 in panel d) (gold ellipses). |
From theoretical point of view, in the current sheet during the magnetic reconnection, there are two basic processes: a) tearing (fragmentation) of the current sheet into plasmoids and b) the opposite process – merging (coalescence) of these plasmoids. The first process can be described as follows: the flare current sheet is stretched by the rising magnetic rope and due to this stretching and the tearing-mode instability the current sheet is fragmented to successively smaller and smaller plasmoids (cascading reconnection) as proposed by Shibata & Tanuma (2001). This concept was further developed by Uzdensky et al. (2010) into the theory of chain plasmoid instability and shown in high-resolution magnetohydrodynamic (MHD) simulations of Bárta et al. (2010, 2011). Besides this fragmentation, Bárta et al. (2011) and Karlický & Bárta (2011) found a new fragmentation process in the region between two merging plasmoids using high-resolution MHD and particle-in-cell (PIC) simulations. It was proposed that the narrowband dm-spikes are radio signatures of this fragmentation (see also Karlický 1984; Karlický et al. 1996, 2000; Bárta & Karlický 2001). Furthermore, a successive merging of the plasmoids was used for an explanation of the-above-the-loop-top hard X-ray sources (Karlický & Bárta 2011).
In the present paper, we study this new type of fragmentation in details. Because any fragmentation increases a number of X-points in the current sheet, this study is also important from the point of view of particle acceleration (see, e.g., Hoshino et al. 2001; Drake et al. 2005; Pritchett 2008; Karlický 2008; Oka et al. 2010). Namely, at the X-points particles are strongly accelerated and a high number of these X-points is needed for a sufficient volume, where particles are accelerated.
This paper is organized as follows: in Sect. 2 the model used is briefly described. The results are shown in Sect. 3. Finally, in Sect. 4, the results are discussed and conclusions presented.
2. Numerical model
We used the same 2.5-D electromagnetic PIC model as in the paper by Karlický & Bárta (2011). The system size was Lx × Ly = 600Δ × 4000Δ, where Δ (=1) is a grid size. In the initial state the Harris current sheet was formed along the line x = 0Δ, and its half-width was L = 10Δ. We considered the electron-proton plasma with the proton-electron mass ratio mp/me = 16. In each numerical cell located far from the current sheet, we initiated n0 = 60 electrons and n0 = 60 protons. In the current sheet the initial number density was enhanced just to keep the pressure equilibrium. The initial electron temperature was taken to be the same in the whole numerical box as T = 10 MK and the temperature of protons was chosen the same as electrons. The plasma frequency was ωpe = 0.05, the electron Debye length λD = 0.6 Δ, and the electron and proton inertial lengths were de = 10 Δ and di = 40 Δ, respectively. To study coalescence processes among plasmoids, we initiated a formation of ten plasmoids along the current sheet by a cosine perturbation of the electric current density in the sheet; with the k-vector k = 2π·10/4000 = 0.0157 Δ-1 and the amplitude corresponding to the current density j given by the magnetic field in the current sheet (j = ∇ × B). The plasma beta parameter was chosen β = 0.07. The free boundary conditions were used. In the following we adopt the dimensionless units based on ωpe and Δ: x → x/Δ and t → tωpe.
3. Results
The presented model evolves globally by the same way as in our previous paper (Karlický & Bárta 2011). We use the same initial setup. But contrary to that paper, here we focus our attention to merging process of two plasmoids, especially to fragmentation processes between these two plasmoids.
In order to describe the magnetic field topological structure and its dynamics we investigated the PIC-simulation result and searched for magnetic null points of X- and O-types. Each creation of X-O null-points pair or bifurcation of already existing null-point represent the topological change of magnetic field, i.e. one atomic reconnection event. The dynamics of the null points during entire simulated time interval is displayed in Fig. 1. The green dots represent the X-points, the red dots the O-points. Due to initial perturbation in the current density (see Sect. 2) the ten X-O pairs of magnetic null points is formed – the O-points representing the centers of newly formed plasmoids and the X-points being located in the current sheets separating the magnetic islands. During the evolution the plasmoids merge successively to larger and larger plasmoids. Due to free boundaries used in the system and small asymmetries in the system initiation, the plasmoids finally merged into one large plasmoid located in the region close to y = 0 (see the global evolution of the system in the right part of Fig. 1). This global motion of plasmoids is also expressed in a global shift of X- and O-point trajectories towards y = 0.
The traditional view on the coalescence instability predict two approaching of O-points (between them there is the X-point) and their subsequent merging into one O-point, see e.g. (Tajima et al. 1987). Nevertheless, Fig. 1 shows a different picture: many new X-O pairs are created during the successive plasmoid merging. This reflects increasing complexity of the magnetic field and its fragmentation to smaller and smaller elements: magnetic islands (plasmoids) separated by small-scale current sheets.
We tried to identify which processes lead to such dynamics. As it has been shown in Bárta et al. (2011) and Karlický & Bárta (2011), one of the possible mechanisms is the secondary plasmoid (tearing-mode) instability in the thin current sheet formed due to the magnetic flux pile-up between mutually approaching plasmoids. An example of such a process we really found in the simulation as shown in Fig. 2. The figure displays magnetic field structure (selected field lines, Bx = 0 and By = 0 lines and magnetic null-points) on the background of current density. Panel (a) shows a global view on a merging of two large plasmoids (at t = 6000) that have themselves been formed by consecutive coalescence of the previously formed smaller magnetic islands. Panel (b) displays the situation at the same time but zoomed to the area around the positive (blue) CS (current sheet) formed between the merging plasmoids. Panel (c) shows formation of a new X-O pair – due to the plasmoid instability in highly compressed and long enough CS – around x = 0, y = 1350 (marked by the gold ellipse) in time t = 6150. Finally, even further fragmentation in the already decaying CS between the plasmoids is seen at t = 6700 in panel (d). Note that the current sheet between these two merging plasmoids as well as all plasmoids move downwards due to the global evolution of the system (see Fig. 1).
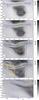 |
Fig. 4 Formation of a new X-O pair due to high-beta stream and its action to magnetic field. The figure shows the plasma beta in logarithmic scale (grayscale) and the velocity field (blue arrows). Other symbols are as in Fig. 2. The panels a)−e) correspond to time instants t = 5800, t = 5900, t = 6200, t = 6300, and t = 6400, respectively. The gold rhomboid in the panel d) shows the region where the long and narrow magnetic field structure (produced by plasma flow) changes to the plasmoid. |
However, not all of the newly formed O-points can be explained by this mechanism because some of them were formed out of the current sheet formed between two merging plasmoid (see Fig. 2d and the corresponding schema in Fig. 3). At this phase of the system evolution the plasma becomes strongly heated and turbulent and thus a question arises, whether also other forces than the Lorentz force can contribute to the ongoing fragmentation of magnetic field structure. In order to address this question we made an analysis of the plasma beta, the local plasma velocity field (calculated as vpl = (mivi + meve)/(mi + me) with the mean velocity of the selected box subtracted) and vorticity in the regions surrounding those newly formed X-O pairs that can not be created by the tearing-mode (plasmoid) instability. The results are shown in Figs. 4 and 5.
Figure 4 shows the magnetic field structure (as in Fig. 2) on the background of plasma beta parameter. Local velocity field is indicated by arrows. As seen here, in the regions of our interest the plasma β parameter is much higher than 1. Panels (a)−(e) correspond to time instants t = 5800, t = 5900, t = 6200, t = 6300, and t = 6400, respectively. The high-pressure horizontal out-flow (stream) (with the maximum velocity close to the local Alfvén velocity) formed due to the reconnection in the “main” X-point in x ≈ −50, y ≈ 1450 in panel (a) deforms the surrounding magnetic field consecutively. The lobe of magnetic flux function Az in the area around x ≈ −120, y ≈ 1350 in panel (b) is formed and becomes longer and narrower (panel c) and eventually a small-scale CS sheet develops in this deformed structure. As its width finally reaches the kinetic dissipation scale the reconnection occurs in this CS what is reflected by the X-O pair formation around x ≈ −140, y ≈ 1250 in panel (d) – emphasized by the gold rhomboid. Panel (e) shows zoomed view on this area at t = 6400.
Figure 5 demonstrates further mechanism of how plasma flows lead to a fragmentation of the current density. Panels (a)−(c) show the magnetic field structure again, now on the background of the plasma vorticity. Corresponding times are t = 5700, t = 6100, and t = 6400, respectively. At the beginning (panel a) almost symmetric reconnection outflows form the typical vorticity pattern due to decreasing velocity-profile further from the axis of the stream. Later (panel b) a pair of vortices is formed on the flanks of the outflow around x ≈ −170, y ≈ 1400. Because of the action of these vortices to magnetic field-lines a new plasmoid is being consecutively formed at this place as can be seen in Fig. 2d. In the following time this vortex is slowly decaying (panel c). The current inside this newly formed plasmoid is then even more intensified, probably by pinching mechanism (shrinkage of the formed O-lines) as can be seen in Fig. 2d around x ≈ −130, y ≈ 1190.
4. Discussion and conclusions
Studying fragmentation processes between two merging plasmoids we found that besides the expected fragmentation due to the tearing-mode (plasmoid) instability there is an additional fragmentation caused by plasma velocity flows (vortices) in the high β-regions of merging plasmoids. This process is physically similar to that caused by shear plasma flows in solar wind (Bettarini et al. 2006) or in the magnetopause (Cowee et al. 2010).
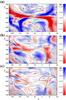 |
Fig. 5 Formation of new X-O pairs due to vortex flows. The blue and red colors show the regions with the enhanced plasma flow vorticity. Other symbols describing the magnetic-field structure are as in Fig. 2. The panels a)−c) correspond to time instants t = 5700, t = 6100, and t = 6400, respectively. |
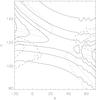 |
Fig. 6 Example of the quadrupolar structure of the magnetic field around the reconnecting current sheet at t = 9000. Full lines mean the magnetic field lines in the x-y computational plane. Dotted and dashed lines show the regions with the negative and positive component of Bz (component of the magnetic field perpendicular to the x-y plane). |
Because in our study we use the PIC simulation we decided to check the findings made by Ji et al. (2004) and Ren et al. (2005) saying that in the collisionless regime of the magnetic field reconnection there are important non-MHD effects. Therefore, in agreement with these papers, we checked a structure of the magnetic field in reconnecting current sheets. We also searched for a presence of the low-frequency electromagnetic waves. Figure 6 shows an example of the quadrupolar configuration of the magnetic field around one reconnecting current sheet (Hall current effect) in our computational system. Furthermore, in some regions and times we found the low-frequency electromagnetic waves (whistlers W), see an example of the dispersion diagram made from the electric field component Ez (the electric field component perpendicular to the x-y computational plane) (Fig. 7). Both these results confirm an importance of the non-MHD effects in the magnetic field reconnection as presented in the papers by Ji et al. (2004) and Ren et al. (2005).
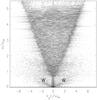 |
Fig. 7 Example of the dispersion diagram showing a presence of the low-frequency electromagnetic wave (whistlers W). It was made from the electric field component perpendicular to the x–y computational plane Ez in the time interval t = 4200−4200 + 204.8 (4096 time steps) and the spatial interval y = 250–250+512 along the axis x = 0. |
In the magnetic field reconnection theory, basically, there exists two approaches to formation of small-scale structures. The first one stresses the role of the Lorentz force and spontaneous, self-generated fragmentation of the magnetic field structures (magnetic field turbulence). The pioneering work in this direction has been done by Shibata & Tanuma (2001) who suggested a conjecture of cascade of tearing-mode instabilities taking place on consecutive smaller scales. Nevertheless, in addition to this tearing-mode cascade (a.k.a. fractal reconnection Shibata & Tanuma 2001; chain plasmoid instability Uzdensky et al. 2010) which we have studied numerically earlier (Bárta et al. 2010, 2011) there exist also fragmentation processes connected with plasmoid merging. In Bárta et al. (2011); Karlický & Bárta (2011) and Karimabadi et al. (2011) the authors found that the coalescence is accompanied by formation of intense, thin current sheets in the magnetic flux pile-up between the merging plasmoids. These current sheets then may become unstable to further plasmoid formation. Hence, the plasmoid coalescence eventually leads to the formation of a single structure, being larger than the two initial, smaller structures. But this process is inherently connected with further fragmentation in the current sheet between the merging plasmoids (fragmenting coalescence). Consequently, also this process contributes – quite unexpectedly – to the energy transport from large to small scales (direct cascade).
The second approach initiated by Lazarian & Vishniac (1999) and further developed by, e.g., Kowal et al. (2009) or Eyink (2011) emphasizes – on the other hand – the role of the velocity field turbulence for formation of small-scale structures in the background magnetic field. The chaotic velocity pattern is usually assumed to be of the “external” origin. The role of flow-field instabilities for fragmentation of the magnetic structure was studied also by Pegoraro et al. (2010) for rather specific flow pattern formed in the solar wind at the flanks of the magnetosphere. However, such highly-sheared velocity field is formed due to the external conditions, again.
A further approach to the problem of fragmentation has been done by Nickeler et al. (2006) and Nickeler & Wiegelmann (2010). In these investigations nonlinear and self-consistent steady-state shear flows generate current(-vortex)-sheets along initial magnetohydrostatic equilibria, showing filamented and fragmented structures. Such shear flows could occur at separatrices, e.g. between open and closed field line structures in the solar atmosphere, but they do not necessarily occur only at this kind of magnetic boundaries. These shear flows need not to be of external origin, but are coupled to a variation of the pressure gradient and basically these flows originate from self-consistent solutions of the MHD equations.
Now, considering our new finding in the reconnection process, it seems that these approaches could be unified. The Lorentz force and “magnetically driven” instabilities (plasmoid instability and fragmenting coalescence) play probably larger role at the beginning of the reconnection in such low-β systems as the current layers in solar flares are supposed to be. Nevertheless, at later stages, the high-β plasma and its flows develop as a consequence of initial reconnection (tearing) events and plasma pressure and kinetic energy in flows start playing significant role. Both the high-β streams (Fig. 4) and the vortex motions (Fig. 5) deform the magnetic field structure, eventually possibly forming new current sheets. In those newly formed CSs a next level of reconnection can start. The picture is similar to that presented by Lazarian & Vishniac (1999) but the chaotic
flow pattern is now created by the reconnection itself. The whole process of fragmentation and cascading to the dissipation scale (turbulence onset) should thus be seen as a rather complicated interplay between magnetic- and flow-field driven instabilities.
Although the numerical simulations were made for the neutral Harris current sheet, i.e. for the current sheet with zero guiding magnetic field, high values of plasma β parameters show that the similar processes can be expected also for the current sheets with non-zero guiding magnetic field, but to some limit values. This aspect is planned to be analyzed in our following study.
Acknowledgments
This research was supported by the grants P209/12/0103 (GA CR), P209/10/1680 (GA CR), and the project RVO:67985815 of the Astronomical Institute of the Academy of Sciences. The authors thank the referee for constructive comments that improved the paper.
References
- Bárta, M., & Karlický, M. 2001, A&A, 379, 1045 [NASA ADS] [CrossRef] [EDP Sciences] [Google Scholar]
- Bárta, M., Karlický, M., & Žemlička, R. 2008a, Sol. Phys., 253, 173 [NASA ADS] [CrossRef] [Google Scholar]
- Bárta, M., Vršnak, B., & Karlický, M. 2008b, A&A, 477, 649 [NASA ADS] [CrossRef] [EDP Sciences] [Google Scholar]
- Bárta, M., Büchner, J., & Karlický, M. 2010, Adv. Space Res., 45, 10 [NASA ADS] [CrossRef] [Google Scholar]
- Bárta, M., Büchner, J., Karlický, M., & Skála, J. 2011, ApJ, 737, 24 [NASA ADS] [CrossRef] [Google Scholar]
- Bettarini, L., Landi, S., Rappazzo, F. A., Velli, M., & Opher, M. 2006, A&A, 452, 321 [NASA ADS] [CrossRef] [EDP Sciences] [Google Scholar]
- Büchner, J. 2006, Space Sci. Rev., 124, 345 [NASA ADS] [CrossRef] [Google Scholar]
- Cowee, M. M., Winske, D., & Gary, S. P. 2010, J. Geophys. Res. (Space Phys.), 115, 6214 [NASA ADS] [CrossRef] [Google Scholar]
- Drake, J. F., Shay, M. A., Thongthai, W., & Swisdak, M. 2005, Phys. Rev. Lett., 94, 095001.1 [NASA ADS] [CrossRef] [PubMed] [Google Scholar]
- Eyink, G. L. 2011, Phys. Rev. E, 83, 056405 [NASA ADS] [CrossRef] [Google Scholar]
- Heyvaerts, J. 1981, in Solar Flare Magnetohydrodynamics, ed. E. R. Priest (New York: Gordon and Breach Sci. Publ.), 429 [Google Scholar]
- Hoshino, M., Mukai, T., Terasawa, T., & Shinohara, I. 2001, J. Geophys. Res., 106, 25979 [NASA ADS] [CrossRef] [Google Scholar]
- Ji, H., Terry, S., Yamada, M., et al. 2004, Phys. Rev. Lett., 92, 115001 [NASA ADS] [CrossRef] [Google Scholar]
- Karimabadi, H., Dorelli, J., Roytershteyn, V., Daughton, W., & Chacón, L. 2011, Phys. Rev. Lett., 107, 025002 [NASA ADS] [CrossRef] [Google Scholar]
- Karlický, M. 1984, Sol. Phys., 92, 329 [Google Scholar]
- Karlický, M. 2004, A&A, 417, 325 [NASA ADS] [CrossRef] [EDP Sciences] [Google Scholar]
- Karlický, M. 2008, ApJ, 674, 1211 [NASA ADS] [CrossRef] [Google Scholar]
- Karlický, M., & Bárta, M. 2007, A&A, 464, 735 [NASA ADS] [CrossRef] [EDP Sciences] [Google Scholar]
- Karlický, M., & Bárta, M. 2011, ApJ, 733, 107 [NASA ADS] [CrossRef] [Google Scholar]
- Karlický, M., Sobotka, M., & Jiřička, K. 1996, Sol. Phys., 168, 375 [Google Scholar]
- Karlický, M., Jiřička, K., & Sobotka, M. 2000, Sol. Phys., 195, 165 [NASA ADS] [CrossRef] [Google Scholar]
- Karlický, M., Bárta, M., Jiřička, K., et al. 2001, A&A, 375, 638 [NASA ADS] [CrossRef] [EDP Sciences] [Google Scholar]
- Karlický, M., Fárník, F., & Mészárosová, H. 2002, A&A, 395, 677 [NASA ADS] [CrossRef] [EDP Sciences] [Google Scholar]
- Karlický, M., Bárta, M., & Rybák, J. 2010, A&A, 514, A28 [NASA ADS] [CrossRef] [EDP Sciences] [Google Scholar]
- Kliem, B., Karlický, M., & Benz, A. O. 2000, A&A, 360, 715 [NASA ADS] [Google Scholar]
- Ko, Y., Raymond, J. C., Lin, J., et al. 2003, ApJ, 594, 1068 [NASA ADS] [CrossRef] [Google Scholar]
- Kołomański, S., & Karlický, M. 2007, A&A, 475, 685 [NASA ADS] [CrossRef] [EDP Sciences] [Google Scholar]
- Kowal, G., Lazarian, A., Vishniac, E. T., & Otmianowska-Mazur, K. 2009, ApJ, 700, 63 [NASA ADS] [CrossRef] [Google Scholar]
- Lazarian, A., & Vishniac, E. T. 1999, ApJ, 517, 700 [NASA ADS] [CrossRef] [Google Scholar]
- Lin, J., Ko, Y.-K., Sui, L., et al. 2005, ApJ, 622, 1251 [NASA ADS] [CrossRef] [Google Scholar]
- Loureiro, N. F., Schekochihin, A. A., & Cowley, S. C. 2007, Phys. Plasmas, 14, 100703 [NASA ADS] [CrossRef] [Google Scholar]
- Magara, T., Mineshige, S., Yokoyama, T., & Shibata, K. 1996, ApJ, 466, 1054 [NASA ADS] [CrossRef] [Google Scholar]
- Milligan, R. O., McAteer, R. T. J., Dennis, B. R., & Young, C. A. 2010, ApJ, 713, 1292 [NASA ADS] [CrossRef] [Google Scholar]
- Nickeler, D. H., & Wiegelmann, T. 2010, Ann. Geophys., 28, 1523 [NASA ADS] [CrossRef] [Google Scholar]
- Nickeler, D. H., Goedbloed, J.P., & Fahr, H.-J. 2006, A&A, 454, 797 [NASA ADS] [CrossRef] [EDP Sciences] [Google Scholar]
- Ohyama, M., & Shibata, K. 1998, ApJ, 499, 934 [NASA ADS] [CrossRef] [Google Scholar]
- Oka, M., Phan, T., Krucker, S., Fujimoto, M., & Shinohara, I. 2010, ApJ, 714, 915 [NASA ADS] [CrossRef] [Google Scholar]
- Pegoraro, F., Califano, F., Faganello, M., & Tenerani, A. 2010, in AIP Conf. Ser. 1242, ed. G. Bertin, F. de Luca, G. Lodato, R. Pozzoli, & M. Romé, 89 [Google Scholar]
- Pritchett, P. L. 2008, Phys. Plasmas, 15, 102105 [NASA ADS] [CrossRef] [Google Scholar]
- Ren, Y., Yamada, M., Gerhardt, S., et al. 2005, Phys. Rev. Lett., 95, 055003 [NASA ADS] [CrossRef] [Google Scholar]
- Shen, C., Lin, J., & Murphy, N. A. 2011, ApJ, 737, 14 [NASA ADS] [CrossRef] [Google Scholar]
- Shibata, K., & Tanuma, S. 2001, Earth, Planets, and Space, 53, 473 [Google Scholar]
- Tajima, T., Sakai, J., Nakajima, H., et al. 1987, ApJ, 321, 1031 [NASA ADS] [CrossRef] [Google Scholar]
- Uzdensky, D. A., Loureiro, N. F., & Schekochihin, A. A. 2010, Phys. Rev. Lett., 105, 235002 [NASA ADS] [CrossRef] [Google Scholar]
All Figures
|
Fig. 1 Space-time trajectories of magnetic null points mapping the evolution of the magnetic field structure (left). The green dots represent the X-points, the red dots the O-points. Panels a)−d) show the global view on magnetic field lines and corresponding current densities (red-blue scale) in the x − y computational plane at four consecutive times: a) at t = 0, b) at t = 3000, c) at t = 5000, and d) at t = 8000. |
| In the text | |
|
Fig. 2 Fragmentation of the current sheet between merging plasmoids (a.k.a. fragmenting coalescence, see Bárta et al. 2011; Karlický & Bárta 2011). Figure displays the current density jz-component (red-blue scale = negatively-positively oriented), magnetic field (black field lines), the lines of Bx = 0 and By = 0 (red and green lines, respectively), and the magnetic null points (X-points: cyan crosses, O-points: magenta squares). Panel a) shows a larger view on the merging of two plasmoids in time t = 6000. Panel b) displays the situation at the same time but zoomed to the area around the positive CS formed between the merging plasmoids. Panel c) shows formation of the new X-O pair around x = 0, y = 1350 (marked by the gold ellipse) in time t = 6150. Even further fragmentation in the already decaying CS between the plasmoids is seen at t = 6700 in panel d) (gold ellipses). |
| In the text | |
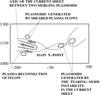 |
Fig. 3 Schema of distribution of generated small-scale plasmoids, compare with Fig. 2d. |
| In the text | |
|
Fig. 4 Formation of a new X-O pair due to high-beta stream and its action to magnetic field. The figure shows the plasma beta in logarithmic scale (grayscale) and the velocity field (blue arrows). Other symbols are as in Fig. 2. The panels a)−e) correspond to time instants t = 5800, t = 5900, t = 6200, t = 6300, and t = 6400, respectively. The gold rhomboid in the panel d) shows the region where the long and narrow magnetic field structure (produced by plasma flow) changes to the plasmoid. |
| In the text | |
|
Fig. 5 Formation of new X-O pairs due to vortex flows. The blue and red colors show the regions with the enhanced plasma flow vorticity. Other symbols describing the magnetic-field structure are as in Fig. 2. The panels a)−c) correspond to time instants t = 5700, t = 6100, and t = 6400, respectively. |
| In the text | |
|
Fig. 6 Example of the quadrupolar structure of the magnetic field around the reconnecting current sheet at t = 9000. Full lines mean the magnetic field lines in the x-y computational plane. Dotted and dashed lines show the regions with the negative and positive component of Bz (component of the magnetic field perpendicular to the x-y plane). |
| In the text | |
|
Fig. 7 Example of the dispersion diagram showing a presence of the low-frequency electromagnetic wave (whistlers W). It was made from the electric field component perpendicular to the x–y computational plane Ez in the time interval t = 4200−4200 + 204.8 (4096 time steps) and the spatial interval y = 250–250+512 along the axis x = 0. |
| In the text | |
Current usage metrics show cumulative count of Article Views (full-text article views including HTML views, PDF and ePub downloads, according to the available data) and Abstracts Views on Vision4Press platform.
Data correspond to usage on the plateform after 2015. The current usage metrics is available 48-96 hours after online publication and is updated daily on week days.
Initial download of the metrics may take a while.