Fig. 4
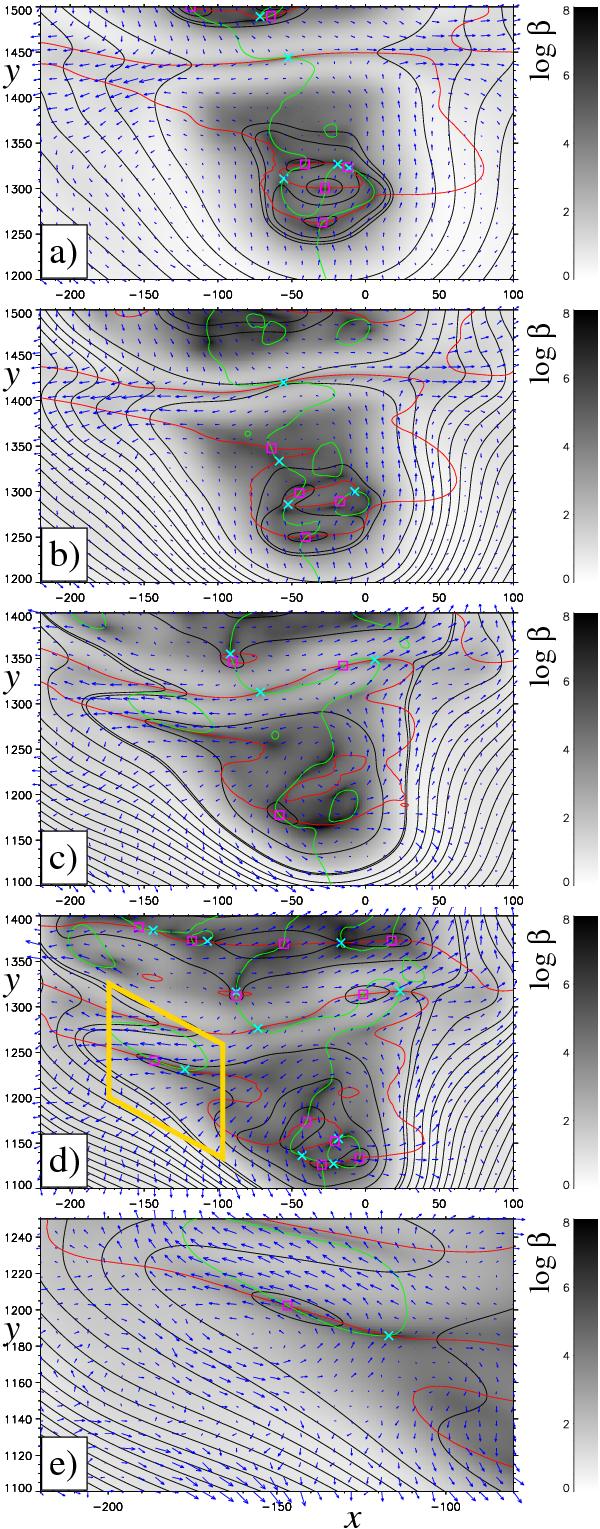
Formation of a new X-O pair due to high-beta stream and its action to magnetic field. The figure shows the plasma beta in logarithmic scale (grayscale) and the velocity field (blue arrows). Other symbols are as in Fig. 2. The panels a)−e) correspond to time instants t = 5800, t = 5900, t = 6200, t = 6300, and t = 6400, respectively. The gold rhomboid in the panel d) shows the region where the long and narrow magnetic field structure (produced by plasma flow) changes to the plasmoid.
Current usage metrics show cumulative count of Article Views (full-text article views including HTML views, PDF and ePub downloads, according to the available data) and Abstracts Views on Vision4Press platform.
Data correspond to usage on the plateform after 2015. The current usage metrics is available 48-96 hours after online publication and is updated daily on week days.
Initial download of the metrics may take a while.