Free Access
Fig. 5
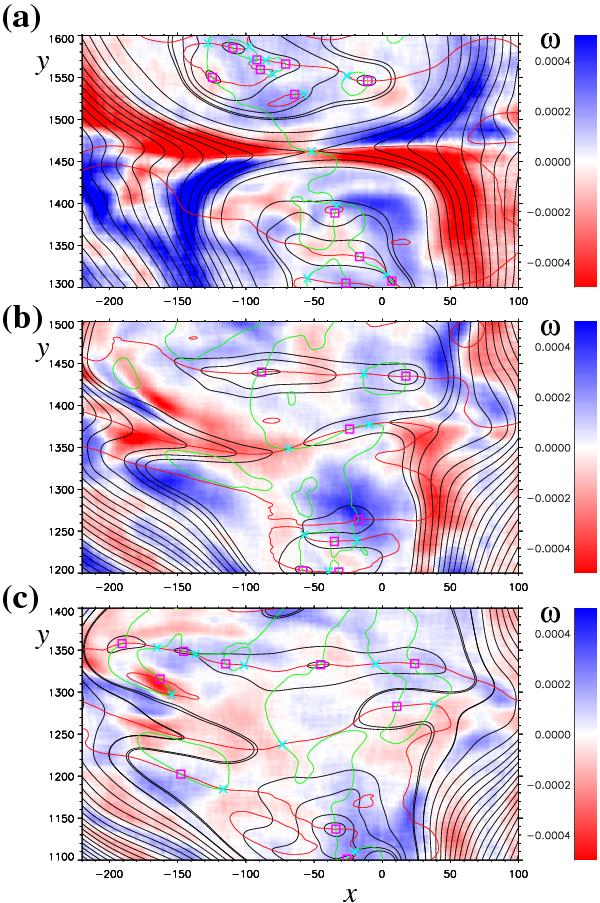
Formation of new X-O pairs due to vortex flows. The blue and red colors show the regions with the enhanced plasma flow vorticity. Other symbols describing the magnetic-field structure are as in Fig. 2. The panels a)−c) correspond to time instants t = 5700, t = 6100, and t = 6400, respectively.
Current usage metrics show cumulative count of Article Views (full-text article views including HTML views, PDF and ePub downloads, according to the available data) and Abstracts Views on Vision4Press platform.
Data correspond to usage on the plateform after 2015. The current usage metrics is available 48-96 hours after online publication and is updated daily on week days.
Initial download of the metrics may take a while.