Fig. 7
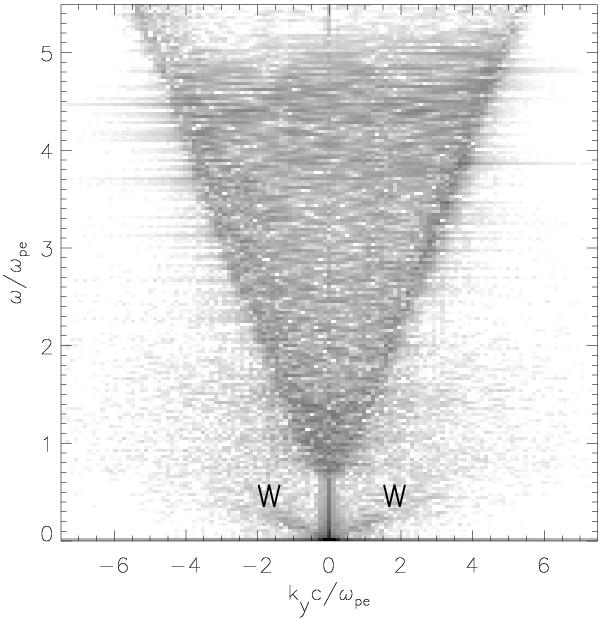
Example of the dispersion diagram showing a presence of the low-frequency electromagnetic wave (whistlers W). It was made from the electric field component perpendicular to the x–y computational plane Ez in the time interval t = 4200−4200 + 204.8 (4096 time steps) and the spatial interval y = 250–250+512 along the axis x = 0.
Current usage metrics show cumulative count of Article Views (full-text article views including HTML views, PDF and ePub downloads, according to the available data) and Abstracts Views on Vision4Press platform.
Data correspond to usage on the plateform after 2015. The current usage metrics is available 48-96 hours after online publication and is updated daily on week days.
Initial download of the metrics may take a while.