| Issue |
A&A
Volume 541, May 2012
|
|
|---|---|---|
| Article Number | A146 | |
| Number of page(s) | 22 | |
| Section | Stellar structure and evolution | |
| DOI | https://doi.org/10.1051/0004-6361/201118440 | |
| Published online | 17 May 2012 | |
On the nature of candidate luminous blue variables in M 33 ⋆,⋆⋆
1 Department of Physics and Astronomy, The Open University, Walton Hall, Milton Keynes, MK7 6AA, UK
e-mail: This email address is being protected from spambots. You need JavaScript enabled to view it.
2 Institute of Astronomy & Astrophysics, National Observatory of Athens, I. Metaxa & Vas. Pavlou St., P. Penteli, 15236 Athens, Greece
3 Departamento de Astrofisica, Universidad de La Laguna, 38205, La Laguna Tenerife, Spain
4 Departamento de Astrofísica, Centro de Astrobiología, (CSIC-INTA), Ctra. Torrejón a Ajalvir, km 4, 28850 Torrejón de Ardoz, Madrid, Spain
5 Departamento de Física, Ingenaría de Sistemas y Teoría de la Señal, Universidad de Alicante, Apdo. 99, 03080 Alicante, Spain
6 School of Chemistry, The University of Nottingham, University park, Nottingham, NG7 2RD, UK
Received: 11 November 2011
Accepted: 16 February 2012
Abstract
Context. Luminous blue variables (LBVs) are a class of highly unstable stars that have been proposed to play a critical role in massive stellar evolution as well as being the progenitors of some of the most luminous supernovae known. However the physical processes underlying their characteristic instabilities are currently unknown.
Aims. In order to provide observational constraints on this behaviour we have initiated a pilot study of the population of (candidate) LBVs in the Local Group galaxy M 33.
Methods. To accomplish this we have obtained new spectra of 18 examples within M 33. These provide a baseline of ≥ 4 yr with respect to previous observations, which is well suited to identifying LBV outbursts. We also employed existing multi-epoch optical and mid-IR surveys of M 33 to further constrain the variability of the sample and search for the presence of dusty ejecta.
Results. Combining the datasets reveals that spectroscopic and photometric variability appears common, although in the majority of cases further observations will be needed to distinguish between an origin for this behavour in short lived stochastic wind structure and low level photospheric pulsations or coherent long term LBV excursions. Of the known LBVs we report a hitherto unidentified excursion of M 33 Var C between 2001-5, while the transition of the WNLh star B517 to a cooler B supergiant phase between 1993−2010 implies an LBV classification. Proof-of-concept quantitative model atmosphere analysis is provided for Romano’s star; the resultant stellar parameters being consistent with the finding that the LBV excursions of this star are accompanied by changes in bolometric luminosity. The combination of temperature and luminosity of two stars, the BHG [HS80] 110A and the cool hypergiant B324, appear to be in violation of the empirical Humphreys-Davidson limit. Mid-IR observations demonstrate that a number of candidates appear associated with hot circumstellar dust, although no objects as extreme as η Car are identified. The combined dataset suggests that the criteria employed to identify candidate LBVs results in a heterogeneous sample, also containing stars demonstrating the B[e] phenomenon. Of these, a subset of optically faint, low luminosity stars associated with hot dust are of particular interest since they appear similar to the likely progenitor of SN 2008S and the 2008 NGC 300 transient (albeit suffering less intrinsic extinction).
Conclusions. The results of such a multiwavelength observational approach, employing multiplexing spectrographs and supplemented with quantitative model atmosphere analysis, appears to show considerable promise in both identifying and characterising the physical properties of LBVs as well as other short lived phases of massive stellar evolution.
Key words: stars: evolution / circumstellar matter / binaries: general / stars: winds, outflows / stars: early-type
Based on observations made with the William Herschel Telescope operated on the island of La Palma by the Isaac Newton Group in the Spanish Observatorio del Roque de los Muchachos of the Instituto de Astrofísica de Canarias.
Appendix is available in electronic form at http://www.aanda.org
© ESO, 2012
1. Introduction
The advent of recent large transient surveys and deep, multiwavelength observations of the stellar content of external galaxies raises the possibility of opening up the final stages of massive stellar evolution to unbiased, quantitative study. Since such objects both drive the evolution of their host galaxies while serving as the progenitors of a number of energetic phenomena, including core collapse supernovae (SNe), gamma ray bursts and X- and γ-ray binaries, an understanding of their brief and violent lifecycle is of wide interest. While it had been supposed that mass loss via (radiatively driven) stellar winds drove the evolution from the main sequence through the H-depleted Wolf Rayet (WR), recent observational and theoretical developments suggest that this in fact might be an oversimplification and that other agents − specifically binary interaction and impulsive mass loss events − may also contribute to this process.
Summary of WHT and Keck spectroscopic target list.
Regarding the former, extensive radial velocity surveys have revealed both a high binary fraction amongst massive stars (e.g. Sana & Evans 2011; Ritchie et al., in prep.) and evidence for distinct binary evolutionary channels (e.g. Clark et al. 2011b) confirming the predictions of previous theoretical studies (e.g. Petrovic et al. 2005). The latter suggestion implicates the mass loss episodes associated with the transitional luminous blue variables (LBVs) in mediating the transition to WRs (Smith & Owocki 2006). Observations of Galactic LBVs demonstrate that a subset are associated with massive dusty circumstellar nebulae (~0.01−15 M⊙; Clark et al. 2003) which have historically been thought to arise in the so-called “giant” eruptions; events characterised by increases in bolometric luminosity (Lbol) and which help distinguish LBVs from other luminous evolved stars (e.g. Humphreys & Davidson 1994). However, recent observations demonstrate that such outbursts appear to be strikingly diverse and are not always accompanied by significant mass loss (e.g. Clark et al. 2009).
Given the possible role played by LBVs in the evolution of massive stars, there is considerable interest in observationally constraining the nature of the outbursts and hence the underlying physics driving these instabilities. Unfortunately, the LBV phase appears to be brief, resulting in only a handful of widely recognised Galactic examples (Clark et al. 2005a). However, recent IR galactic plane surveys have greatly expanded on the number of known candidates (Clark et al. 2003; Gvaramadze et al. 2010; Wachter et al. 2010; Stringfellow et al. 2011). Such objects are invaluable since their spatially resolved circumstellar ejecta comprise a record of their mass loss history, although their distribution throughout the plane means that long term monitoring to determine their duty cycles is an observationally expensive proposition.
An alternative approach is to observe candidates in external galaxies. While such a strategy complicates the spatial separation of stellar and nebular emission, it is observationally efficient given current 4−8 m class telescopes and associated multiplexing spectrographs. Moreover, such an approach, informed by ongoing SNe monitoring campaigns has the potential to efficiently identify new examples of giant LBV eruptions for detailed follow ups; the so-called “SNe imposters”. In order to complement our ongoing program of observations of Galactic LBVs, we have recently undertaken a pilot study of (candidate) LBVs in M 33 to assess the efficacy of this strategy1.
To accomplish this we obtained new 4000−7000 Å spectroscopic observations of 17 (candidate) LBVs (Table 1) selected from the seminal paper by Massey et al. (2007, henceforth Ma07); the resultant ≥ 4 yr baseline between observations well matching the characterstic timescale of LBV excursions. The S/N, spectral resolution and wavelength coverage of the resultant spectra − encompassing Hα, a prime mass loss diagnostic, as well as temperature and metallicity diagnostics between 4000 − 5000 Å − in principle permits non-local thermal equilibrium (non-LTE) model atmosphere analysis of the stars in question. We were also able to supplement this dataset with three additional unpublished spectra obtained in 2003 at the W. M. Keck Observatory and which are further described in Sect. 2. Of these spectra two were of targets already included in our WHT target list and one – M 33 Var B – was new.
Moreover, we may also make use of the wealth of existing data on the stellar population of M 33 in order to investigate both the photometric history of, and the presence (or otherwise) and properties of dusty circumstellar ejecta associated with the (candidate) LBVs. For this facet of the program we utilised the full census of such stars published by Ma07 (their Table 18, not reproduced for brevity, which contains all 18 objects for which we obtained spectroscopy), supplemented with the remaining WN9-11h and B super-/hyper-giants within M 33 as well as additional cLBVs from a variety of sources; the additional stars and associated references are listed in Table 22.
Consequently, the paper is structured as follows. Data acquisition and reduction is described in Sect. 2, with the resultant spectra discussed in Sect. 3, with the full dataset present online in Appendix A. Photometric data are presented in Sect. 4 and we discuss the nature of the candidate LBVs in Sect. 5, before summarising and placing our results in a wider context in Sect. 6.
2. Observations and data reduction
The spectroscopic observations of 17 of our targets (Table 1) were performed at the 4.2 m William Herschel Telescope (WHT) in the “Observatorio del Roque de los Muchachos” in La Palma, Spain. We used the AutoFib2 plus Wide Field Fibre Optical Spectrograph (AF2-WYFFOS) combination for multi-object spectroscopy. WYFFOS can be fed with up to 150 1.6″-diameter fibres, positioned on the user provided coordinates by the AF2 robot over a wide (~1 deg diameter) field of view.
Summary of additional candidate LBVs in M 33.
The observing run started on 2010 September 29 and lasted four nights. We designed two AF2 fibre configurations to cover our targets. In both cases, we first optimized the number of allocated fibers and their priority (which was assigned based on obtaining a full sample of each sub-category of candidate LBV defined by Ma07, prior indication of variability and optical magnitude) and maximized the number of allocated sky fibers (see below) afterwards. We used the R1200B and R1200R gratings to cover the optical-blue spectra (~4000−5000 Å) and Hα region with a resolution of roughly 2 Å. The total exposure time for the first configuration amounted to 9 h and 6.5 h with the R1200B and R1200R gratings respectively, broken into 1800 s blocks for cosmic-ray subtraction. Due to weather conditions, the second configuration was only observed during 2.5 h with R1200B; consequently, the spectra of stars observed in this configuration have much poorer signal-to-noise ratios.
The data were reduced following the recipe implemented in the pipeline provided by the AF2 webpage3 at that time. We modified the original procedure to include an initial normalization of the flat-field before its correction, and an algorithm for cosmic ray rejection (van Dokkum 2001). The code then follows the standard steps for multi-fibre spectrum reduction, using IRAF4 tasks: bias, flat-field correction, throughput calibration between fibres, wavelength calibration and sky subtraction.
Due to the fibres head-size and distribution, fibres cannot be placed closer than 25″ to one another, and therefore an accurate and individual sky subtraction is not possible since information on each star’s local background is not available. In addition to the fibres positioned on M 33 stars, a set of supplementary fibres were added to our configurations to obtain an average estimation of the sky contribution. Subtracting this component allows us to remove both the Earth atmosphere effects and any contribution in the M 33 field. However, the local nebular contamination will still be present in the final reduced stellar spectra, and must be considered in the analysis. The nebular contamination mainly affects the Balmer lines, and usually leaves the rest of relevant lines for morphological classification and quantitative analysis unaffected.
Additionally, we were able to make use of unpublished spectra with a resolution of ~1.8 Å of M 33 Var B and C and J013350.12+304126.6 obtained on 2003 November 30 with the DEIMOS spectrograph at the W. M. Keck Observatory; a discussion of data acquisition and reduction may be found in Cordiner et al. (2008).
Finally, we also employed publically available optical and mid-IR photometric data to study the full M 33 candidate LBV census of Ma07, supplemented with the stars in Table 2. These data consist of the optical photometric variability surveys of Shporer & Mazeh (2006) and Hartman et al. (2006) as well as the single epoch study of Massey et al. (2006) and the multi-epoch mid-IR surveys of McQuinn et al. (2007) and Thompson et al. (2009); these data are analysed in Sect. 4.
3. Spectroscopy
Ma07 divide their candidate LBVs into five subsets. Of these, the P Cygni and Ofpe/WNL stars are well defined spectral and evolutionary classifications, while the bona fide LBVs such as M 33 Var B and C are also clearly identifiable; we adopt these categories unchanged. However the remaining groupings – the hot and cool LBV candidates – are more problematic since such nomenclature implies a specific evolutionary phase for what are likely heterogeneous sets of objects.
Motivated by the appearance of M 33 Var C in photometric minimum, Ma07 apply a classification of hot candidate LBV to those stars showing strong emission in both the Balmer series and low excitation metallic transitions such as Fe ii, although they recognise that such criteria will also include stars demonstrating the B[e] phenomenon (e.g. Lamers et al. 1998). This is intriguing, given the still uncertain physical relationship between both classes of star and the current lack of placement of the latter in a coherent evolutionary scheme (see e.g. Zickgraf 2006, for a review of this topic). Unfortunately, the limited spectral resolution and wavelength coverage of the existing spectra of these stars prevent us from inferring the geometry of the circumstellar material via line profiles (e.g. Zickgraf et al. 1985) or H i line ratios (Lenorzer et al. 2002) and hence distinguishing between both possibilities. Moreover the Fe ii emission line spectra of LBVs are also highly variable (e.g. AG Car, HR Car, R71 and R127; Stahl et al. 2001; Szeifert et al. 1996; Wolf et al. 1981, 1988; Walborn et al. 2008) depending on the phase of the LBV excursion, preventing the determination of specific line-ratio classification criteria.
Furthermore, such Fe ii-rich emission spectra are typically seen during and close to optical maximum, when LBVs are thought to be at temperature minimum, rather than in the hot phase supposed by Ma07 (cf. the above studies). Consequently, we prefer the historical term “Iron star” for such objects (cf. Walborn & Fitzpatrick 2000) to simply reflect the spectral appearance of the stars.
Similar issues are associated with the cool LBV classification. Specifically, the range of temperatures experienced by an LBV during an excursion appears to show an explicit luminosity dependance (e.g. Wolf 1989). For example the high luminosity star R127 is observed to vary between an Ofpe to a late B-/A-hypergiant classification (e.g. Walborn et al. 2008) whereas the low luminosity object HD 160529 only transits between B8 to A9 Ia+ classifications (Stahl et al. 2003); thus HD 160529 would be classified by Ma07 as a cool LBV in both hot and cool phases. Given that the examples of this classification found within M 33 are consistent with B- and early A-hypergiants (e.g. Clark et al. 2010, 2012; Walborn & Fitzpatrick 1990), we favour a simple morphological classification of blue hypergiant (BHG) for these stars.
Following this approach we suggest a classification of cool hypergiant for stars demonstrating the rich absorption+emission lines spectra associated with B324 and Var C in its cool phase (Sects. 3.5, 5.3.2 and 5.3.3). While a subset of such stars clearly may be LBVs undergoing excursions, some, such as B324 and the yellow hypergiants within Wd 1 (Clark et al. 2010) show long term stability over decadal timescales, while others, such as ρ Cas, instead transit to still cooler temperatures during outburst (Lobel et al. 2003). While we recognise that this requires the re-assessment of the cool LBV candidates presented by Ma07, as with the iron star and BHG classifications, this terminology relies solely on spectral morphology and carries no explicit evolutionary connotation, which may require additional multi-wavelength/epoch observations to determine.
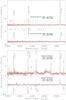 |
Fig. 1 Multiepoch optical spectra of selected stars. Top panel – illustrative Iron stars and bottom panel – the P Cygni LBV J013416.07+3-3642.1 and the B hypergiant J013416.44+303120.8. |
3.1. Iron stars
We obtained spectra of four iron stars (Table 1, Figs. 1 and A.1). Comparison of these data to previous observations revealed that none of these stars unambiguously demonstrated behaviour characteristic of the LBV phenomenon, although significant spectral variability was undoubtedly present in two of them. This is illustrated by the spectra presented in Fig. 1, where for J013242.26+302114.1 we see a clear change in the emission line ratio of the Balmer series in the ~4 year period between observations, with a decrease (increase) in strength of Hβ (Hγ). Similar changes in the Balmer series over an identical time period are also seen in J013324.62+302328.4, with a dramatic decrease in the strength of Hβ between the two observations.
A number of spectra of J013406.63+304147.8 are present in the literature, dating from from 1993-5 (Massey et al. 2006), with subsequent spectra published by Shemmer et al. (2000), Sholukhova et al. (2011) and Fabrika et al. (2005). While significant multiyear gaps exist between these observations, comparison of these to our new spectra suggests that there has been a lack of conspicuous variability over this ~17 yr period, with only minor changes in the line profile of He i 4471 Å and the anomalously strong Fe ii 4556 Å line at a single epoch5.
Finally, despite a >15 yr baseline, we see no gross variation in spectral morphology between the <1995 spectrum of Massey et al. (1996) and our 2003 Keck and 2010 WHT spectra of J013350.12+304126.6 beyond minor changes in emission line strength.
We also provide the first observations of three of these stars in the 6000 − 7000 Å window which encompasses Hα. In each case it is strongly in emission – as expected given the behaviour of the higher Balmer transitions – with a single peaked non-P Cygni profile demonstrating strong emission wings. Nebular [N ii] and [S ii] is present in two of the four stars; given the comparative strength of the latter relative to the former we suspect this arises from a spatially coincident H ii region rather than CNO processed circumstellar ejecta. Remaining emission lines may predominantly be attributed to He i and Fe ii.
3.2. B hypergiants
We have made new spectroscopic observations of five BHGs from Ma07 (Table 1, Figs. 1 and A.2). Historically, a classical temperature diagnostic for such stars is the He i 4471 Å: Mg ii 4481 Å line ratio (Walborn & Fitzpatrick 1990), with the Mg ii absorption strengthening relative to He i for later spectral types. Comparison of our spectra to those of Ma07 suggests that this ratio has varied in two of the five stars examined; J013416.44+303120.8 (illustrated in Fig. 1) and J013422.91+304411.0. Utilising this diagnostic, we would estimate formal spectral types of ~ B8 (2006) and ~B2.5 (2010) for J013416.44+303120.8 (aided by comparison to examples presented in Monteverde et al. 1996) and ~A0 (2006) and ~B5-8 (2010) for J013422.91+304411.0, with the absence of He i absorption in the spectrum presented by Ma07 suggesting a later spectral type in 2006 than 2010 (e.g. by comparison to IFM-B 1330; Monteverde et al. 1996).
However, we caution against concluding that a secular evolution in temperature – as might be expected for an LBV excursion – has occured on this basis alone. Firstly, we note that B-supergiants are prone to short period pulsational instabilities, as illustrated by examples found with Westerlund 1 (Clark et al. 2010; see also Sect. 4) and we cannot rule such an explanation out on the basis of the current limited dataset. Moreover detailed quantitative non-LTE model atmosphere analysis of Galactic B-hypergiants by Clark et al. (2012) found that the behaviour of this line ratio may also depend on the location of the transition region between photosphere and wind; thus it does not serve as an unambiguous temperature diagnostic. Unfortunately, the low S/N ratio of the available spectra precludes us employing more robust diagnostics such as the Si iii/Si ii ratio.
Line profile variability (LPV) is also observed in the Balmer transitions of these stars. This is particularly notable in the Hβ emission line of J013357.73+301714.2 (a weakening of the P Cygni profile from 2006), J013422.91+304411.0 (transition of P Cygni to pure emission profile), J103424.78+303306.6 (weak P Cygni emission transitioning to absorption) and J013429.64+ 303732.1 (the evolution of a single peaked to a P Cygni profile superimposed on a broad base), while variability is also observed in the higher transitions of J013357.73+301714.2, J013416.44+303120.8 and J013429.64+303732.1. Comparable LPV has been observed in the (wind) emission lines of Galactic B super-/hyper-giants (e.g. Clark et al. 2010; Morel et al. 2004; Kaufer et al. 1996) and LBVs (Stahl et al. 2003). In the former it occurs over short (~days) timescales and has been associated with stochastic wind structure, while in the latter it is associated with the LBV cycle; the current lack of sampling precludes us from unambiguously distinguishing between either possibility, although the lack of other associated spectral changes argues against an LBV identification.
Unfortunately, the comparatively low S/N and resolution of the Hα profiles presented in Ma07 precludes comparison to our data but we note that all five stars present an identical profile consisting of a narrow emission line superimposed on a broad base (Fig. A.2), similar to those observed in the mid- to late-B hypergiants in Westerlund 1 (Clark et al. 2010). Finally nebular [N ii] and [S ii] emission of ambiguous origin is present in four of the five stars observed although, as with the iron stars, we suspect this is not associated with circumstellar ejecta.
3.3. P Cygni stars
Ma07 identified four counterparts to the Galactic LBV P Cygni within M 33, with spectra dominated by narrow emission profiles in the H i and He i lines; we have made observations of three of these (Figs. 1, 2 and A.3). As with the BHGs, LPV is present and observed in the Hβ line of J013341.28+302237.2 and the He i lines of J013416.07+303642.16. Discovery and subsequent follow up spectra of both stars extend the baseline of observations to ≥ 17 yr for the former (Monteverde et al. 1996, Ma07) and ≥ 18 yr for the latter (Spiller 1992; Corral 1996; Kehrig et al. 2011), but provide no evidence for (LBV driven) secular evolution during these intervals. For completeness we note that Urbaneja et al. (2005) prefer a classification of B1 Ia+ for J013341.28+302237.2 (=[HS80] 110A) which they find to be a highly luminous object with a high mass loss rate in comparison to Galactic examples (Clark et al. 2012); we return to this point in Sect. 5.3.3.
In contrast, comparison of the available dataset of J013339.52+304540.5 indicates dramatic long term variability (Fig. 2). Crowther et al. (1997) first studied this star in detail, finding that there was little evidence for photometric variability between the mid-1970s to 1990s and provided spectroscopy from 1991, 1992 and 1995 which likewise indicated little or no evolution. Further low resolution spectra were subsequently obtained in 1992-4 (Corral et al. 1996), 1993 (Massey et al. 1996) and 2006 (Ma07). Subject to the comparatively low resolution and S/N of the spectra, we find no evidence of variability between 1991 − 1992, but in 1993 the He i 4471 Å line appeared to be in absorption, before reverting to (P Cygni) emission by 1995. However, our new spectrum indicates a dramatic change in morphology in the intervening period, with the disappearance of He i, He ii and N ii emission, a substantial weakening of the Balmer lines and the development of weak photospheric features in e.g. Si iii. The spectrum presented by Ma07 reveals that the evolution had commenced prior to 2006, demonstrating an absence of emission from high excitation species, albeit accompanied by significantly stronger emission in the Balmer lines than observed in either preceding or subsequent spectra.
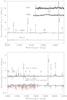 |
Fig. 2 Multiepoch optical spectra of selected LBVs. Top panel – the P Cygni star J013339.52+304540.5; note that the 2010 spectrum is reproduced in Fig. A.3, where weak Si iii, O ii and C iii absorption features are visible. Bottom panel – the bona fide LBV M 33 Var C, with the spectrum of the cool F0-5Ia+ hypergiant B324 overlayed (Monteverde et al. 1996, and Sect. 5.3.2). |
Model atmosphere analysis of J013339.52+304540.5 by Crowther et al. (1997) suggests Teff ~ 23 kK, M ~ 4.9 × 10⁻⁵ M⊙ yr-1 and v∞ ~ 275 km s-1 at this time (with the authors suggesting the H/He ~ 0.8 ratio was indicative of a post LBV phase). We may qualitatively attribute the change in spectral morphology to a decrease in both stellar temperature and wind density, the former indicated by the disappearance of high excitation features such as He ii and the latter by the weakening of the wind emission lines. In principle one might hope to obtain an estimate of the temperature from the photospheric lines present. In comparison to J013341.28+302237.2 (Teff ~ 21 kK), the lack of a strong C iii+O ii complex at ~4650 Å, as well as the presence of Si iii 4552, 68 and 75 Å absorption is suggestive of a later classification (~B2; Teff ~ 18 kK), although we cannot exclude a somewhat earlier classification if the star is C-depleted (noting that subject to the caveats in Sect. 3.2, the absence of Mg ii 4481 Å argues against a cooler temperature). Unfortunately, the current spectra are of insufficient S/N to be able to utilise the Si ii and iv transitions to obtain a more accurate temperature estimate; consequently we are currently obtaining suitable spectra (and contemporaneous photometry) to permit such a detailed model-atmosphere analysis.
3.4. Ofpe/WNL (=WN9-11h) stars
Ofpe/WNL (=WN9-11h) is a well defined stellar classification, although we note that at the low temperature extreme such stars share signficant morphological similarities with the P Cygni stars. This is well illustrated by a comparison of the spectra of J013416.07+303642.1 (P Cygni type; Fig. A.3) and Romano’s star (Ofpe/WNL type; Fig. A.4), both with one another and also with a (degraded) spectrum of P Cygni itself; we return to this topic in Sect. 5.3.1. Of the 12 such stars curently identified within M 33 (Ma07; Neugent & Massey 2011) we have made observations of three; J013309.14+304954.5, J013327.26+303909.1 and J013509.73+304157.3 (henceforth Romano’s star).
Of these, minor changes in the strength of the wind emission lines appear present in J013327.26+303909 (not shown for brevity); such variability appears common amongst Galactic WRs with a number of mechanisms proposed to explain this (e.g. binarity, pulsations, wind structure). Unfortunately, the spectrum of J013309.14+303954.5 (=UIT045) is of rather poor S/N; despite this it would appear that the blend of N ii+He i+He ii emission that is prominent between 4600−4700 Å in the discovery spectrum ( ≤ 1995: Massey et al. 1996) is now absent. Following the preceding dicussion, the spectrum now bears close resemblance to the P Cygni-type stars. Nevertheless, further observations of both both stars will be required to first validate and subsequently constrain the nature of the (putative) variability.
In contrast, Romano’s star is a well known photometric (ΔV ~ 16−18.6) and spectroscopic variable, demonstrating a ~WN8h spectrum in visual minimum and as least as late as WN11h in visual maximum (Maryeva & Abolmasov 2010; Polcaro et al 2011; Sholukhova et al. 2011)7. Indeed following these recent studies it appears clear that it should be considered a bona fide LBV, a classification we adopt for the remainder of the paper.
Our spectrum implies a ~WN10h classification, compared to a ~WN9h spectral type only 7 months earlier; consistent with the star simultaneously undergoing a secular photometric brightening. We highlight the close similarity to P Cygni at this time; the sole observational differences – the presence of weak He ii 4686 Å and the lack of P Cygni profiles in the Balmer series – consistent with a somewhat higher temperature (Sect. 5.3.1).
3.5. Bona fide LBVs
Finally, we turn to the three remaining stars – J013416.10-303344.9 and M 33 Var B and C – which Ma07 denote as LBVs (inevitably without spectroscopic classification criteria due to their variability; Table 1 and Fig. A.5). The 4000 − 5200 Å spectra of J013416.10+303344.9 and M 33 Var C obtained in 2010 and the 2003 spectrum of M 33 Var B share very similar morphologies, being dominated by P Cygni Balmer and Fe ii emission lines, which are strongest in the latter star. P Cygni He i emission lines are present in M 33 Var B and C, but are in absorption in J013416.10+303344.9. The spectral morphology of M 33 Var B and C, when observed in 2003 and 2010 (respectively), appear to resemble composites of the P Cygni and iron star classifications (Fig. A.5), suggesting that the physical properties of these stars at the times of these observations were intermediate between these subtypes. Indeed, the spectrum of M 33 Var B is strongly reminiscent of P Cygni (Fig. A.5) – although the presence of Fe ii emission implies a cooler, denser wind than that star.
In contrast, the 2003 spectrum of M 33 Var C is of a very different character, being dominated by a wealth of low excitation metallic absorption lines, with only Hβ weakly in emission. Comparison to the 2010 observation and the highly luminous F0-5 Ia+ hypergiant B324 (Fig. 2; Monteverde et al. 1996) indicates a significantly later spectral type at this epoch. While the Hα line is saturated in the 2003 spectrum (as it is in the other 2 DEIMOS/Keck spectra), weak P Cygni emission is present in the 40 and 70 multiplets of Fe ii; again similar to B324 (Sect. 5.3.3).
Regarding variability, the candidate LBV J013416.10+ 303344.9 was observed by both Monteverde et al. (1996) and Massey et al. (1996) between 1993-5; comparison of these data to our new spectrum show a broadly similar morphology, although the Balmer lines appear to have strengthened in this period. In contrast, the LBV classifications of M 33 Var B and C are long established (e.g. Szeifert et al. 1996; Viotti et al. 2006, and references therein). Ma07 present the most recent high resolution blue end spectra of M 33 Var B that we are aware of (from 1993 and 2005); our spectrum differs notably from both of these, although in the absence of a contemporaneous lightcurve or better temporal spectroscopic coverage we do not discuss this further. Finally, while clearly highly variable, we defer analysis of the spectral evolution of M 33 Var C to Sect. 5.3.2, where it is discussed in the context of the long term photometric behaviour of the star.
4. Photometry
Photometric variability is a defining property of LBVs, and in addition to our new spectra, we may utilise existing photometric surveys (e.g. Hartman et al. 2006; Shporer & Mazeh 2006; McQuinn et al. 2007; Thompson et al. 2009) of M 33 to further constrain the nature of the candidate stars (Ma07, supplemented with objects listed in Table 2).
4.1. Optical photomety
Ma07 briefly reviewed the optical photometric data available for the candidate LBVs within M 33, identifying variables both by comparison of historical to Local Group Galaxies Survey (LGGS; Massey et al. 2006) observations and also via the multi-epoch photometric surveys of Hartman et al. (2006) and Shporer & Mazeh (2006). Expanding on this, we retrieved and examined the individual lightcurves of the 15 stars flagged as variables by these studies. Of these, only one star demonstrated previously unidentified, coherent long term variability – the iron star J013459.47+303701.0 (Fig. 3). While this is potentially consistent with an LBV identification we note that the star became bluer as it brightened, whereas the opposite behaviour might be expected, with LBVs typically cooling as they brighten.
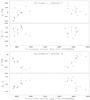 |
Fig. 3 Sloan g′ and (g′ − i′) colour index plotted against time for the candidate LBVs J013426.11+303424.7 and J013459.47+303701.0. Data from Hartman et al. (2006). |
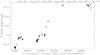 |
Fig. 4 V band photometry of M 33 Var C from Shporer & Mazeh (2006), with the timing of the spectroscopic observation discussed in Sect. 3.5 indicated. |
Of the known LBVs, the 2000-2003 lightcurve of M 33 Var C (Shporer & Mazeh 2006) is of particular interest (Fig. 4), since it indicates a ~0.8 mag. brightening between 2001-2 July, followed by an apparent plateau with V ~ 15.4 mag (comparable to the maximum light of the two previous maxima; Humphreys et al. 1988). We return to discuss the combined photometric and spectroscopic dataset for this star in Sect. 5.3.2.
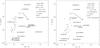 |
Fig. 5 Colour magnitude plots for (candidate) LBVs within M 33, following the ammended classification scheme of Ma07. Stars associated with hot dust are identified in Sect. 4.2. Note that Massey et al. (1996) associate the brightest object, J013350.92+303936.9 (=UIT218), with the galactic nucleus – an apparently composite source with an F Ia spectral type rather the hot LBV classification given in Ma07 – while J013242.26-301214.1 lacks an (R − I) indice. |
After excluding known (photometrically variable) LBVs such as M 33 Var C from the sample, apparently aperiodic photometric variability of ≤ 0.4 mag. amplitude was associated with the remaining objects (e.g. J013426.11+303424.7; Fig. 2)8. Likely driven by pulsations, quasi-periodic photometric variability over timescales of tens to hundreds of days appears ubiquitous amongst supergiants of spectral type B and latter – the so called α Cygni variables (van Leeuwen et al. 1998; Clark et al. 2010) – as well as LBVs (Lamers et al. 1998) and it is tempting to attribute the variability to this cause (with a combination of changes in the pulsational period and poor temporal sampling accounting for the lack of identifiable periodicity). Finally, we note that despite rather large amplitude (ΔV ~ 0.8 mag.) historical photometric and spectroscopic variability (Ma07; Fig. 1), the iron star J013242.26+302114.1 was not flagged as variable by either survey, nor were a number of the spectroscopic variables identified in this work9, including the strong LBV candidate J013339.52+304540.5 (Sect. 3.3 and Fig. 2; although pre-empting the following section, the BHG J013429.64+303732.1 is a mid-IR variable).
We may also utilise the LGGS photometry to construct colour manitude plots for the candidates of Ma07, which we show in Fig. 5. We can clearly identify the blue plume of highly luminous blue supergiants that Massey et al (2006) describe. However, plotting both (B − V) and (V − I) colour indices demonstrates that a number of individual objects such J013340.60+304137.1 show rather discrepant colours, unfortunately making dereddening individual stars problematic.
Nevertheless, of the objects plotted, the brightest, J013350.92+303936.9 (=UIT 218, which Ma07 label as a hot LBV candidate) is in fact the spatially extended nucleus of M 33, which Massey et al. (1996) show has an F supergiant like spectrum (and hence we do not consider it further). The next brightest, J013355.96+304530.6 (=B324) appears to be both intrinsically bright and possesses the latest spectral type of any object considered here – we return to this in Sects. 4.2 and 5.3.3.
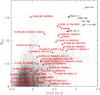 |
Fig. 6 Mid-IR colour magnitude plot of stellar point sources within M 33. Related dusty, high mass loss rate massive evolved objects within M 33 and the Galaxy also plotted for comparison (filled and empty black circles respectively). See Sect. 4.2 for origin of individual data points. Note that J013350.92 = 303936.9 (=UIT218) is associated with the galactic nucleus and is likely a composite source. |
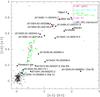 |
Fig. 7 Mid-IR colour colour plot of candidate LBVs and related stars within M 33, with the massive stellar population of the Large Magellanic Cloud shown for comparison (data from Bonanos et al. 2009). The outlying LMC WC star with [3.6] – [4.5] ~ 0.94 is the heavily reddened triple system BAT99-38, while the LMC LBV with [4.5] – [8.0] ~ 2.5 is R71. |
Of the remaining objects from Ma07, the Ofpe/WNL stars appear to be the faintest subtype, with V > 17.5, although there is some overlap with both the P Cygni and B hypergiants. With V < 18 and < 17.5 respectively, these subtypes appear systematically brighter (as might be expected from the larger visual bolometric corrections anticipated for the Ofpe/WNLs). Given their intrinsic variability, bona fide LBVs span a wide range of magnitudes, with Romano’s star having been found to be at least 0.6 mag fainter in the V band than shown here (e.g. Sholukhova et al. 2011). Finally, and somewhat unexpectedly, the iron stars are found to span the largest magnitude range (ΔV ~ 3.5 mag); we return to the nature of these objects in Sect. 5.2.
Mid-IR fluxes for new candidate LBVs and BHGs.
4.2. Mid-IR photometry
M 33 has been the subject of extensive mid-IR studies, with six epochs of Spitzer/IRAC (3.6 − 8.0 μm) observations between 2004 January and 2006 February (unfortunately not contemporaneous with the LGGS photometry or the spectroscopy of Ma07 and this work). Point source catalogues derived from these data have been compiled by McQuinn et al. (2007) and Thompson et al. (2009) enabling identification with the source list of Ma07; a task undertaken by the latter authors. To this list we were able to add the additional candidates listed in Table 2 and cross correlated the expanded census against both catalogues (as well as adopting fluxes for four sources kindly provided by Valeev 2011, priv. comm.).
We found a total of 29 sources had a detection at one or more wavebands. Of these 18 were from the catalogue of Thompson et al. (2009; including three BHGs previously unconsidered by these authors), four supplied by Valeev et al. (2009) and seven new counterparts unique to McQuinn et al. (2007). Of the 16 stars from the catalogue of Ma07 identified as having mid-IR counterparts by Thompson et al. (2009), 13 were found in the catalogue of McQuinn et al. (2007). These showed systematic offsets of m3.5 ~ 0.15 mag and m4.5 ~ 0.2 mag in the sense that the magnitudes in Thompson et al. (2009) were brighter; a corresponding correction has not been applied to the values presented in Table 3 but has been applied in Figs. 6 and 7 to enable direct comparison. No obvious offset was found with respect to 8 μm fluxes, although we caution that individual sources in all 3 bands show significantly greater offsets than described here10; in such cases we adopt the relevant fluxes from Thompson et al. (2009).
Broken down by nature of source11 14 of 18 iron stars, 9 of the 13 BHGs, one each of the 11 Ofpe/WNL and four P Cygni candidates, all four LBVs and the sole cool hypergiant, B324, are detected in one or more wavebands. Fluxes for those sources not listed by Thomspon et al. (2009; their Table 3) are given in Table 3 of this paper. Only three stars are found to be variable; M 33 Var C, J013429.64+303732.1 (Thompson et al. 2009) and Romano’s star. The lightcurve of M 33 Var C (Fig. A.3 of Thompson et al. 2009) is particularly interesting, since fortuitously the Spitzer observations commenced at the point when the optical observations of Shporer & Mazeh (2006; Fig. 4) ended and indicate a ~0.8 mag fade over a period of ~400 days commencing early in 2005; we return to this in Sect. 5.3.2.
A number of different physical processes might be expected to contribute to the ~3−8 μm fluxes of the sources, including photospheric emission (potentially from a putative cool companion), free-free continuum emission from a dense wind and thermal emission from a dusty circumstellar environment (either resulting from dust condensation in a wind shock in a colliding wind binary or in red supergiant/LBV ejecta). Given this, the current uncertainty in the parameters of the underlying stars (and hence the stellar contribution to the composite spectral energy distribution) and the potential difficulty in accounting for the contribution of line and molecular (e.g. PAH) emission in the continuum bands, quantitative analysis of individual sources appears premature. Nevertheless, we may attempt to determine the likely nature of the mid-IR emission from different objects in a statistical sense utilising various different mid-IR colour/magnitude and colour/colour diagnostic plots that have been developed for such evolved massive stars (e.g. Hadfield et al. 2007; Bonanos et al. 2009).
Following Thompson et al. we initially utilise the [3.6] − [4.5] vrs. M4.5 colour/absolute magnitude plot (Fig. 6 – employing a distance modulus, μ = 24.92; Bonanos et al. 2006). The stellar population of M 33 is predominantly located in the lower left of the plot, with a plume extending to larger M4.5, that likely represents a combination of foreground and intrinsically luminous (composite) sources. A population of dusty, (extreme) AGB stars appear to dominate the region of the diagram delineated by M4.5 > − 11 and approximately [3.6] – [4.5] > 0.5 (Thompson et al. 2009). Finally, a population of massive, evolved stars are located in the upper right corner. Following these authors and Khan et al. (2011), we plotted selected Galactic objects here for comparison, noting that the [3.6] − [4.5] colour indices of these stars suggest the presence of hot dust (with a simple black body temperature, TBB ~ 350−1000 K).
We may supplement this with the [3.6] − [4.5] vrs. [4.5] − [8.0] colour colour plot of Bonanos et al. (2009; Fig. 7). The nature of the emission from sources in this diagram is best demonstrated by plotting the massive stellar population of the Large Magellanic Cloud (excluding the cool supergiants; Bonanos et al.). The OBA super-/hypergiant and WRs form a continuous sequence of increasing mid-IR colour excess, with the latter redder than the former. This may simply be understood as the increasing contribution from free-free emission, which on average is more pronounced for the WRs due to their denser winds. LBVs and Ofpe/WNL stars are also found along this sequence, with an additional contribution from circumstellar dust explaining the outliers. Finally, stars exhibiting the B[e] phenomenon form a distinct group, with their very red colours the result of the hot dust that characterises such objects.
In the colour magnitude plot (Fig. 6), the majority (18) of the stars with mid-IR detections appear to be broadly co-located with the underlying stellar population of M 33 (approximately bounded by M4.5 > − 11 and [3.6] − [4.5] < 0.5); these consist of representatives of each of the ammended morphological classifications of Ma07 (bar the single cool hypergiant, B324). In the absence of quantitative modeling, the nature of the IR emission of these stars is uncertain, although we suspect it is due to a combination of wind (free-free) and photospheric emission. Indeed the three mid-IR variables – M 33 Var C, Romano’s star and the BHG J013429.64+303216.0 – are located in this region and none show correlated mid-IR colour/magnitude changes (e.g. in the sense that they become redder as they brighten), as might be expected if the emission originated in a variable dusty circumstellar environment.
Unfortunately, only seven of these stars have 8 μm detections (Fig. 7). Of these, Romano’s star and M 33 Var C are co-located along the OBA supergiant/WR sequence; suggestive of wind+photospheric emission (although Valeev et al. 2009, attributes the IR emission to hot dust, highlighting the difficulty in interpretation). The remaining objects12 are all displaced from this locus by virtue of their comparatively strong 8 μm emission, implying the presence of warm circumstellar dust. Note however, that the absence of a pronounced 8 μm flux does not mean that the remaining stars lack dusty ejecta, since emission from LBV nebulae typically peaks at significantly longer wavelengths (e.g. Egan et al. 2002; Clark et al. 2003; Voors et al. 2000).
A further 11 stars are found outside this region of the colour magnitude plot. Of these, the mid-IR colours of the iron star J013242.26+302114.1 are suggestive of wind+photospheric emission (Fig. 7) and while no 8 μm detection is available for J013355.96+304530.6 (=B324), we suspect a similar origin for its 3.6 − 4.5 μm flux, given both its intrinsic extreme luminosity and strong wind emission lines (Sect. 5.3.3).
This then leaves nine mid-IR luminous stars (M4.5 < −11), all of which are iron stars13. These are found in a sequence of increasing M4.5 and [3.6] − [4.5] colour (Fig. 6) that terminates amongst highly luminous evolved stars with rich dusty circumstellar environments such as the Galactic RSGs NML Cyg (Schuster et al. 2009) and VY CMa (Smith et al. 2001), the LBV η Car (Smith et al. 2002), the YHG IRC +10 420 (Blöcker et al. 1999) and, within M 33, the cool transient M 33 Var A (Humphreys et al. 2006) and Object X (Khan et al. 2011). Of these, four – J013324.62+302328.4, J013426.11+303424.7, J013459.47+303701.9 and J013500.30+304150.9 – are co-located with the sgB[e] stars (Fig. 7), while the colours of a further two – J013333.22+303343.4 and J013350.12+304126.6 – are also suggestive of (a smaller quantity of) hot dust.
The final three stars – N93351, N125093 and J013442.14+303216.0 – also appear associated with hot dust, although their larger 8 μm fluxes imply greater quantities of warm dust is also present with respect to the former objects. Unfortunately, due to the lack of longer wavelength data we refrain from attempting to determine temperature(s) for the dust component(s)14, although Bonanos et al. (2009) report dust temperatures of ~600 K for those LMC sgB[e] stars for which 24 μm fluxes are available.
These stars are found to span an unexpectedly wide range of ~3 mag in the V band (Fig. 5), including objects that appear to be either intrinsically faint (e.g. J013324.62+302328.4) and/or subject to significant reddening (e.g. J013459.47+303701.9). Similar behaviour is also found at mid-IR wavelengths, with the nine stars spanning ≥ 2.3 mag in the 4.5 μm bandpass. The two brightest objects – J013350.12+304126.6 and N125093 – are comparable to the cool transient M 33 Var A and the Galactic YHG IRC +10 420 (Fig. 6). However their mid-IR colours suggest differences in dust temperature in comparison to these objects, particularly for J013350.12+304126.6 which, by virtue of its 8 μm flux, appears to lack a warm dust component.
Turning to the fainter extreme and we find that the four faintest mid-IR sources from this subset are those that have mid-IR colours consistent with sgB[e] stars. With V > 18 mag. these are also amongst the faintest stars at optical wavelengths (Fig. 5). Bonanos et al. (2009) report that the LMC sgB[e] stars experience greater reddening than normal OB stars; given the reddened optical colours of J013426.11+303424.7 and J013459.47+303701.9 we suspect that this may also be the case for these stars. An (extreme) example of this behaviour would then be the evolved massive star “Object X”, where extensive recent mass loss has rendered it the brightest stellar object within M 33 in the mid-IR, but undetectable at wavelengths shortwards of the V band (Khan et al. 2011). Applying magnitude (M4.5 < − 11.5) and colour (0.5 < [3.6] − [4.5] < 1.5) cuts designed to identify massive dusty objects, Thompson et al. (2009) identified a further 16 optically faint and 9 optically undetectable sources within M 33, and it is tempting to attribute our subset of optically faint iron stars associated with hot dust to a low extinction tail of this population; we return to the nature of these objects in Sect. 5.2.
5. Discussion
A central goal of this work is the determination of the physical and evolutionary nature of the stellar sample. It is easy to place both the Ofpe/WNL and P Cygni stars at the high temperature extreme of an LBV excursion, with the former appearing to be both hotter and to have larger wind terminal velocities (for a comparable mass loss rate, leading to a lower wind density) than the latter (e.g. Clark et al. 2011a, and in prep.). However, how may the remaining stars be accommodated?
5.1. The BHGs
Clark et al. (2012) studied the Galactic population of BHGs and found that they appeared to result from two distinct channels, with high luminosity examples such as ζ1 Sco found in a pre-LBV phase and lower luminosity objects such as HD 160529 being post-RSG objects potentially encountering the LBV phenomenon as they evolve to higher temperatures. Given the concerns regarding both dereddening individual stars and the use of the He i 4471/Mg ii 4481 Å ratio as a temperature diagnostic (Sect. 3.2) we refrain from calculating bolometric luminosities for individual BHGs discussed in this study. Nevertheless assuming negligible reddening, a bolometric correction appropriate for an A0 spectral classification (BCA0 = −0.15 mag and for reference BCB2 = −1.59 mag; Clark et al. 2005b) and a lower limit of V ~ 17.5 for the range of optical magnitudes spanned by these stars, results in a minimum bolometric luminosity of log (L/L⊙) ~ 5.0; consistent with both low and high luminosity/mass channels. Thus their individual placement in an evolutionary scheme will have to await systematic model atmosphere analysis, although of the three BHGs subject to such a study (Urbaneja et al. 2005, 2011) [HS80] 110-A is found to be unexpectedly luminous, (Sect. 5.3.3), while the stellar+wind properties of both UIT 005 and OB10-10 are similar to those of pre-LBV Galactic BHGs (Clark et al. 2012).
5.2. The iron stars
5.2.1. LBV candidates
While resulting in a heterogenous group of stars (Sect. 3), the observational criteria employed by Ma07 to define the class of iron stars (Sect. 3.1) are clearly successful in identifying LBV candidates. The candidatures of N45901, N93351 and N125093 are discussed by Valeev et al. (2009, 2010), and are supported by pronounced photometric variability (N93351 and potentially the remaining stars), mid-IR excesses (N93351 & N125903; Sect. 4.2) and the presence of [Ca ii] λλ 7291, 7323 emission (N93351 and N125093), which appears associated with variable/eruptive stars such as M 33 Var A and IRC +10 420. The impressive similarity of the spectrum of J013350.12+304126.6 to that of the LBV R127, together with its pronounced mid-IR excess, flags it as a strong candidate even in the absence of current variability, while the mid-IR properties of J013442.14+303216.0 also points to the presence of a cool dusty circumstellar environment. J013459.47+303701.9 also appears dusty and demonstrates coherent photometric variability (Fig. 3); although it is optically fainter than the preceding examples this may in part be due to greater (intrinsic) reddening. Finally Ma07 report striking spectroscopic variability in J013332.64+304127.2 (from a WNL to iron star morphology), although unlike the preceding examples this star does not appear to support an IR excess.
Therefore, under the assumption that a subset of both the iron stars and BHGs are indeed bona fide LBVs, consideration of confirmed high and low luminosity LBVs (e.g. AG Car, HR Car, R71, R127 and HD 160529) allows us to infer a broad physical progression from high to low temperatures in terms of the ammended classification scheme of Ma07:  This sequence is subject to three caveats; that (i) progress between subtypes is continuous (cf. the apparent hybrid spectra of M 33 Var B; Sect. 3.5), (ii) the precise appearance of the spectra are also subject to the properties of the stellar wind, which are also found to vary through an LBV excursion (e.g. Groh et al. 2009) and (iii) depending on stellar luminosity, the full range of subtypes may not be experienced, with lower luminosity examples not reaching the hottest Ofpe/WNL and P Cygni phases (cf. Wolf 1989).
5.2.2. B[e] star candidates
As discussed in Sect. 4.2 we have identified a subset of objects with IR excesses consistent with the hot dust that characterises sgB[e] stars and which are amongst the optically faintest of our sample (see Thompson et al. 2009, for individual SEDs). While this in part may be the result of a high degree of (circumstellar?) reddening towards certain objects, both J013500.30+304150.9 and J013324.62+302328.4 appear to suffer little extinction and hence are likely to be intrinsically faint (Fig. 5). Given the absence of photospheric features, determining bolometric corrections for both these stars is difficult. However, adopting values from Clark et al. (2005b) appropriate for the range of spectral types suggested for Magellanic Cloud sgB[e] stars (B0 to B8; Zickgraf et al. 1986) we find, prior to applying an uncertain reddening correction15, log (L∗/L⊙) ~4.1−5.1 and ~4.2−5.2 for, respectively, J013324.62+302328.4 and J013500.30+304150.9. Such luminosities are below those of the sgB[e] stars analysed by Zickgraf et al. (1986) and known Galactic LBVs (Clark et al. 2005a), but they are consistent with a lower luminosity population of stars demonstrating the B[e] phenomenon identified by Gummersbach et al. (1995).
What might be the physical nature of the B[e] star candidates? As described by Lamers et al. (1998), the B[e] phenomenon occurs in both single and binary stars with a range of masses and evolutionary states. The lack of apparent molecular bands in the spectra of these stars would appear to exclude symbiotic systems, while the mid-IR colours appear inconsistent with those of (massive) young stellar objects (e.g. Bolatto et al. 2007). If a subset of stars are confirmed to be of low luminosity (log (L∗/L⊙) ≤ 4.7), they would have corresponding progenitor masses of ≤ 15 M⊙ (under the assumption they have left the main sequence; Meynet & Maeder 2000). While they may not be directly identified with the extreme AGB stars identified by Thompson et al. (2009) – since their emission spectra imply they must be substantially hotter – such luminosities are comparable to those of the dust enshrouded progenitors of SN 2008S and the 2008 transient in NGC 300, which are found to be optically obscured, mid-IR bright and non variable (Prieto 2008; Prieto et al. 2008; Thompson et al. 2009). Consequently it is tempting to consider the possibility that the 2 classes of object may be related, but subject to differing intrinsic absorptions; a suggestion first advanced for low luminosity sgB[e] stars in the LMC by Bonanos et al. (2009).
More luminous candidates would be comparable to the bona fide sgB[e] stars in the Magellanic Clouds. While the physical mechanism that leads to the production of sgB[e] stars is currently uncertain, by analogy to classical Be stars it is suspected that high rotation rates are necessary for the formation of a circumstellar disc. Both binary interactions and mergers have been invoked to spin up the star, while a variant of this scenario – the presence of a circumbinary disc produced by short lived binary driven mass transfer – has been invoked to explain the sgB[e] star Wd1-9 (Ritchie et al., in prep.). Given this, it is particularly interesting that radial velocity shifts led Sholukhova et al. (2004) to conclude that J013406.63+304147.8 is a short period binary, with mass loss in the equatorial plane leading to a sgB[e] classification.
5.3. Individual objects
5.3.1. Romano’s star
As highlighted in Sect. 3.4, observational studies clearly reveal the LBV nature of Romano’s star. Recent quantitative modeling of the star during the optical minimum of 2007/8 and the local optical maximum in 2005 by Maryeva & Abolmasov (2010) reveal significant differences between the two epochs in the sense that the star was both hotter and more compact during optical minimum, as expected for canonical LBV excursions. Interestingly, however, these authors report a significant differnce in bolometric luminosity between the two phases, whereby the star was more luminous during optical minimum; a point we return to later.
Stellar parameters derived for Romano’s star.
Given that a central goal of our program is to quantitatively follow the evolution of the stellar parameters of LBVs through their excursions/outbursts, Romano’s star provided an ideal proof-of-concept; moreso since our spectroscopy and quasi simultaneous photometry (Sholukhova et al. 2011) indicates that it appeared to be in a state intermediate between those described by Maryeva & Abolmasov (2011). To accomplish this we utilised the non-LTE model atmosphere code CMFGEN (Hillier & Miller 1998, 1999) and followed the methodology previously employed for the spectroscopically similar stars P Cygni (Najarro 2001) and NGC 300 B16 (Bresolin et al. 2002), with the observational constraints provided by our September 2010 blue and red spectra and the photometric values from Sholukhova et al. (2011).
The latter were obtained within one month of our spectrospic observations and according to Sholukhova et al. (2011), the object’s V magnitude varied between 17.75 and 17.85, with B ranging from 17.65 and 17.75, resulting in an average (B − V) ~ −0.10 (Fig. 2b of Sholukhova et al. 2011). During this epoch, the object was moving from the hotter, minimum brightness to the cooler, maximum brightness phase, being closer to the former. Fortunately, though rather weak, the He iiλ4686 line could be used to constrain the ionization equilibrium and therefore derive the effective temperature of the star16.
Nevertheless, when combined with the ionization status displayed by the star, the moderate S/N of our spectra hamper an accurate determination of all stellar properties. Reliable estimates could be obtained for the effective temperature, Teff, stellar luminosity, L∗, the wind terminal velocity v∞, the H/He ratio and the mass-loss rate, Ṁ. On the other hand, stellar parameters such as the exponent of the velocity field (β), degree of wind clumping (fV) and nitrogen and silicon abundances are subject to larger uncertainties, while only upper limits may be returned for additional elements (e.g. Fe, C, Mg). In order to investigate this behaviour we ran a suite of models at solar, 0.7 × solar and 0.4 × solar metallicity and, apart from the Si lines, found no significant differences in either the quality of the final fit or the basic stellar properties, noting that higher S/N observations at maximum brightness (cooler phase) would unambiguously constrain the metallicity of the object. Because of this result metallicity had to be assumed for our analysis. To accomplish this we utilized [O/H] estimates from the literature based on the radial position of the star within M 33. According to Romano (1978) the star is placed at a projected distance of 17′ (4.8 kpc) from the center of the galaxy, for which Neugent & Massey (2011) and Bresolin (2002) derive [O/H] ~ 8.25 − 8.30 and [O/H] ~ 8.30 respectively, corresponding to 0.4 × solar. We adopted this value for the abundances of Na, Mg, Al, S, Ca, Ti, Cr, Mn, Fe, Co and Ni and assumed a distance of 964kpc to M 33 (Sect. 4.2)17.
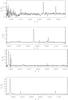 |
Fig. 8 Comparison of the synthetic spectrum (dashed) to the 2010 Sept. observations (solid) of Romano’s star. |
The results of this analysis are summarised in Table 4, while we compare our best-fit synthetic spectrum to observations in Fig. 8. As the emission strength of He iiλ4686 is extremely sensitive to the effective temperature in this parameter domain we derive an uncertainty of ~ 500 K for the Teff of the object. Taking into account the uncertainties in the distance, photometry and reddening we estimate an error of 0.15 dex for the stellar luminosity. Wind properties are fairly well constrained. The terminal velocity, v∞ = 265 ± 50 km s-1, is set by the P Cygni profiles of the He i lines which, together with the shape of the emission components of Hα and Hβ, help constrain β. We adopted a two β-law with a flat β = 6 component in the inner parts and a steeper β = 0.9 law in the outer wind. Despite the medium S/N of our spectra, the strong electron scattering wings of Hα point towards the presence of moderate clumping, fV = 0.25.
Given the moderate spectral resolution of our observations we were not able to unambiguously identify and subtract potential nebular contamination of the H i lines introduced by the fibre size (1.6′′ diameter; Sect. 2). To compensate for this we placed larger weight on reproducing the He i and higher H i Balmer lines than on Hα and Hβ when determining Ṁ. Thus our current favoured model slightly underestimates emission in the latter transitions and we estimate a likely error of ≤ 25% on this parameter in light of this uncertainty. We obtain H/He = 1.5 by number with H/He = 2.0 and H/He = 1.2 as upper and lower limits respectively. The silicon abundance, with an uncertainty of 0.2 dex, is basically constrained by the strength of the Si iiiλ4550 − 4575 lines. Our derived nitrogen abundance reproduces satisfactorily the main optical N ii and N iii lines but overestimates significantly the N iiλ6482 line, which leads to a larger uncertainty (0.3 dex) on the resulting abundance (a mass fraction XN = 7 × 10⁻³). Note that the [N ii] nebular lines were not employed in this determination. Upper limits to carbon and oxygen abundances of 0.07 × solar and 0.20 × solar were found, indicating a depletion in both elements.
Our results agree very well with those found by Bresolin et al. (2002) for the WNLh star B16 in NGC 300 and encouragingly – and as might be anticipated – land between the stellar parameters derived by Maryeva & Abolmasov (2011) for the minimum and maximum brightness phases (thus giving us confidence in our treatment of potential nebular contamination). Our derived E(B − V) = 0.06 is also consistent with the results of their analysis and yields a deredenned V = 17.62. Interestingly, our derived Si abundance, which is roughly a factor of three lower than their value, agrees very well with the abundance of the other α-elements obtained from nebular abundances at that galactocentric distance (Bresolin 2011). The nitrogen enrichment and the upper limits on the C and O abundances are consistent with an WNL evolutionary phase, characterized by an LBV-like behaviour.
Multi-epoch, quantitative analyses of the LBVs AG Car (Groh et al. 2009), HD 5980 (Georgiev et al. 2011) and S Dor (Lamers 1995) have been made during their characteristic photometric excursions, and it is interesting to compare the properties of Romano’s star to these objects. As with AG Car and HD 5980, the mass loss rate is found to increase and wind velocity decrease with decreasing temperature (Lamers 1995 does not report these parameters for S Dor). However, the bolometric luminosities of AG Car, HD 5980 and S Dor are found to decrease with the simultaneous reduction in temperature and increase in stellar radius, whereas the opposite appears to be the case for Romano’s star (Mareya & Abolmasov 2011).
It is thought that the reduction in bolometric luminosity for the first three objects results from the additional energy required to support the expansion of the outer layers of the stars; if correct this would imply that the overal energy budget of Romano’s star increased during its excursion. In this regard we highlight that the behaviour of the Galactic LBV AFGL2298 also implies an increase in the rate of energy production during its “eruption”, although in this case the growth in stellar radius occured at ~ constant temperature (Clark et al. 2009). If the results of these studies are replicated for these and other stars, the clean demarcation between luminosity conserving excursions and non-luminosity conserving eruptions in LBVs will break down, despite the superficial similarities in their spectral and photometric evolution (cf. AG Car, S Dor and Romano’s star); consequently raising the question as to whether a single physical mechanism underlies their divergent behaviour.
5.3.2. M 33 Var C
M 33 Var C has been the subject of considerable photometric and spectroscopic attention since its discovery (Hubble & Sandage 1953), albeit of irregular temporal coverage. Burggraf et al. (2011) present the most complete long term (~1900 − 2010) B-band optical light curve available, with observations reported in Humphreys et al. (1988) and Szeifert et al. (1996) extending the wavelength coverage to the V- and R-bands. These data reveal two prominent photometric maxima (B ~ 14−15, V ~ 15.2) between 1945 − 50 and 1984 − 8. Outside of these events, the star was typically observed with B ~ 16 − 17.5 (V ~ 16−17) although for at least 2 decades prior to its initial brightening in 1940 it appeared to be in an extended faint phase (B ~ 17.5−18, V ≥ 17). As can be inferred from the magnitude ranges quoted, significant short term variability also appears to be present (e.g. Fig. 4) in addition to the uncertainties associated with the historical observations. Nevertheless M 33 Var C currently appears to be in an extended bright phase which commenced in ~1940 and upon which are superimposed two further outbursts separated by ~ 40 yr (Burggraf et al. 2011). The somewhat sparse post-1990 photometric data presented by these authors appear to indicate a plateau state (B ~ 16.4) from ~ 1990 − 2005 after which M 33 Var C faded by ~0.8 mag.
Spectroscopic observations are likewise uneven. During both visual maxima M 33 Var C demonstrated an F-supergiant plus Balmer emission line spectrum analagous to S Dor in its bright phase (Hubble & Sandage 1953; Humphreys et al. 1988). Outside of these events, the limited spectroscopy appears to indicate an earlier B spectral type dominated by Fe ii and Balmer line emission – cf. the most recent high S/N and resolution spectrum of Szeifert et al. (1996), dating from 1992. More recently, Viotti et al. (2006) suggest a similar appearance in 2002 while, somewhat surprisingly, Burggraf et al. (2011) claim – but do not show – a much later spectral type coinciding with the current photometric fade.
The spectroscopic and photometric data presented here suggest a hitherto unreported excursion analagous to the 1940s and 1980s events. Commencing in ~2001 July the optical peak was reached a year later and was maintained for a further year, during which M 33 Var C demonstrated the F-supergiant emission line spectrum that characterised previous outbursts. If our interpretation of the mid-IR emission is correct (Sect. 4.2) this maximum light plateau endured until 2005 February. The limited sampling of the B-band lightcurve of Burggraf et al. (2011) meant that they completely missed this event; unfortunately it casts doubt on their conclusion that the bright phases of M 33 Var C occur on a ~40 yr period. Moreover, these data appear to demonstrate that spectral variability in M 33 Var C may occur over relatively short timescales, with an F-hypergiant spectrum observed in 2003 (this work), B emision line in 2004 (Viotti et al. 2006), late F in ~2008 (Burggraf et al. 2011) and B emission in 2010. For comparison recent complete outburst cycles (hot to cool phase and back again) of AG Car and HR Car occured over ~10 and ~8 years respectively (Stahl et al. 2001; Szeifert et al. 2003).
5.3.3. [HS80] B324
Visually one of the brightest stars within M 33, B324 is discussed at length by Monteverde et al. (1996) who highlight both its late, possibly variable spectral type (F0-F5 Ia+ in 1994 versus A5 Iae prior to 1990; Humphreys et al. 1990) and LPV in the Balmer series. P Cygni lines are observed in the FeII multiplets 40 and 70, which require a dense and ionised medium to be driven into emission. Such a morphology is rare, being demonstrated by both M 33 Var B and C (Szeifert et al. 1996; and this work) during their cool photometric maxima and the Galactic yellow hypergiant (YHG) IRC+10 420 (Fig. 9), a star thought to be transiting rapidly to hotter temperatures as it executes a red loop across the HR diagram.
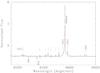 |
Fig. 9 Comparison of the 1996 spectrum of the emission line F hypergiant B324 (solid line; Monteverde et al. 1996) against the Galactic YHG IRC +10 420 degraded to a comparable spectral resolution (red dotted line; Oudmaijer et al. 1998). Similar Fe ii P Cygni emission lines are also observed in the 2003 spectrum of M 33 Var C. |
However, the similarities to IRC+10 420 appear to end here. Prior to the 1990s IRC +10 420 underwent a long term photometric brightening (Patel et al. 2008) and while B324 also appears photometrically variable (eg. Ma07) the limited data are consistent with α Cygni-like variability. Moreover IRC +10 420 is associated with significant dusty circumstellar ejecta of recent origin leading to a substantial IR excess (Blöcker et al. 1999); in contrast, despite its intrinsic luminosity the mid-IR colours of B324 do not appear consistent with other massive stars experiencing, or having recently undergone, heavy mass loss (Fig. 6)18. Finally, B324 appears significantly more luminous than IRC +10 420. Adopting V = 14.86 and (B − V) = 0.43 (Massey et al. 2006) and the intrinsic colours of a F5 Ia star ((B − V)o = 0.15; Fitzgerald 1970) leads to E(B − V) = 0.28 and AV = 0.87 (assuming AV = 3.1E(B − V) and subject to previous caveats regarding the uncertainty in dereddening individual stars). Then assuming a negligible bolometric correction and μ = 24.92 we find log (L∗/L⊙) ~ 6.3, placing it significantly in excess of the empirical Humphreys-Davidson limit.
Such a luminosity appears to be incompatable with a star evolving through a YHG phase via a red loop across the HR diagram, suggesting instead that an identification with a cool phase LBV outburst may be more appropriate (cf. M 33 Var B and C). A consequence of this is that since there is currently no observational evidence for long term secular variability, B324 appears to have remained in its current extended “outburst” phase for at least twenty years. However, decades long outbursts have been observed in both the cool hypergiant M 33 Var A ( ≥ 35 yr; Humphreys et al. 2006) and R127 (~30 yr ; Walborn et al. 2008), while M 33 Var C has yet to return to its pre-1940 quiescent state, suggesting that such behaviour is not without precedent. Intriguingly, the BHG [HS80] 110A is also located above the HD limit (log(L/L⊙) ~ 6.5 ± 0.1 and Teff ~ 21 ± 1 kK; Urbaneja et al. 2005) and shows no evidence for LBV-like variability over the past ≥ 17 yr (Sect. 3.3). Likewise, the Galactic BHG Cyg OB2 #12, which is also found to violate the HD limit, has remained stable for over a century (Clark et al. 2012).
6. Global considerations and concluding remarks
Finally, what may we infer from the current population of candidate LBVs within M 33? Together with the photometric selection criteria employed by Ma07, multiepoch observations employing wide field imagers and multiobject spectrographs on 4-m class telescopes appear ideally suited to their study, as illustrated by the identification of a third LBV excursion of M 33 Var C between 2001-5. Combining existing spectroscopic and photometric datasets reveals a number of new LBV candidates in addition to the well studied historic examples (e.g. Szeifert et al. 1996; Viotti et al. 2006; Ma07). The dramatic spectroscopic variability of the P Cygni star J013339.52+304540.5 and the WNL star J013332.64+304127.2 (Ma07) makes a compelling case for both objects. Pronounced long term photometric variability is present in the BHG J013429.64+303732.1 and the iron star J013459.47+303701.0.
Moreover, low level optical photometric and spectroscopic variability appears ubiquitous amongst our sample, with LPV in the wind lines present in examples of all the (modified) classifications introduced by Ma07 and in the photospheric lines of the BHGs (particularly the Mg ii/He i diagnostic lines). Unfortunately, our current temporal sampling is insufficent to distinguish between an origin of the former behaviour in short lived stochastic or long lived LBV driven changes in the properties of the wind, while the latter could arise in photospheric pulsations, secular evolution of stellar temperature and/or changes in the structure of the wind/photospheric boundary. Nevertheless, optical photometry strongly suggests that many of the stars are α Cygni variables and hence likely pulsationally unstable.
We find that the spectroscopic data are also of sufficient quality to permit non-LTE model atmosphere analysis and we present a proof-of-concept study of Romano’s star. The successful analysis of this star demonstrates the efficacy of our observational approach, but emphasises that high S/N and resolution data are mandatory to distinguish between Ofpe/WNL and P Cygni classifications and to determine the temperature of the BHGs (e.g. via the Si ii:Si iii ratio). Moreover, more extensive spectral observations would be required to ascertain the full elemental composition of such stars as well as to drive down the uncertainties on parameters such as the wind clumping factor.
As expected from the spectroscopic data – being intermediate between those obtained in photometric minima and maxima – we found that the physical properties of Romano’s star in 2010 imply a smooth progression between these extremes. We note that the increase in bolometric luminosity with increasing radius and decreasing temperature is in the opposite sense to that demonstrated by AG Car, S Dor and HD 5980, in which bolometric luminosity is observed to decrease. In combination with analysis of AFGL2298 this suggests that the simple division of LBV behaviour into bolometric luminosity conserving excursions and non-conserving eruptions is overly simplistic.
As suspected by Ma07, the subset of iron stars appear to be rather heterogeneous containing, in addition to strong LBV candidates, a number of objects that can formally be classified as B[e] stars on the basis of their optical and mid-IR properties. Their nature is currently uncertain, but the lower luminosity subset may be related to the class of dusty, highly obscured objects identified by Thompson et al. (2009) as potential progenitors of transients such as SN 2008S, albeit suffering less self extinction. These authors find that approximately 25 of the 45 objects with similar mid-IR colours and magnitudes to the low luminosity B[e] stars (M[4.5] < − 11.5 and 0.5 < [3.6] − [4.5] < 1.5) are likewise optically faint or invisible, suggesting that they comprise an important component of the population of the most IR luminous stellar objects within M 33.
Of the remaining iron stars, N93351, N125093, J013350.12+304126.6 and J013442.14+303216.0 possess optical spectra consistent with confirmed LBVs and mid-IR properties (colours and magnitudes) approaching known massive evolved stars with extensive recent or ongoing mass loss; a connection with the recently discovered “Object X” – the brightest stellar mid-IR source detected within M 33 (Khan et al. 2011) – would be unsurprising. No stars appear to be as mid-IR luminous as η Carinae currently is, despite over a century elapsing since its eruption. While this might be considered evidence of the rarity of comparable events, such a conclusion is hampered by observational bias – one might expect highly luminous stars to be located in active star forming regions that may themselves be IR bright leading to a lack of detection due to source confusion. Five further stars have 8 μm fluxes that are suggestive of the presence of dusty ejecta. While the bona fide LBVs M 33 Var C, Romano’s star and spectroscopic candidates J013339.52+304540.5 and J013332.64+304127.2 lack near-mid IR excesses we may not at present exclude the presence of ejection nebulae associated with these stars, since emission from such dusty structures surrounding Galactic LBVs typically peaks at longer wavelengths.
Adopting the modified classification scheme of Ma07 and excluding the non-LBV subset of BHGs and iron stars we infer a progression of Ofpe/WNL → P Cygni → iron star/BHG → cool hypergiant for the transition from high to low temperatures. Due to the empirical luminosity dependance of the amplitude of LBV excursions, lower luminosity examples may not reach the Ofpe/WNL and P Cygni phases, while some well studied LBVs such as AG Car have yet to be observed in a cool hypergiant phase (Stahl et al. 2001). Conversely, Romano’s star and the SMC system HD 5980 (Koenigsberger et al. 2010, and refs. therein) suggest that LBV-like excursions may also extend to somewhat earlier WN subtypes than employed in this scheme ( ≤ WN8), while some cool hypergiants such as M 33 Var A and ρ Cas are instead observed to transit to cooler temperatures in outburst.
In conclusion, such galaxy wide multiepoch observations employing large sample sizes appear well suited to the determination of the duty cycle and physical nature of the outbursts and eruptions of LBVs and related objects, as well as the length of the LBV phase (via comparison of number counts to main sequence, Wolf-Rayet and cool super-/hypergiant populations). However, several caveats must be considered. Firstly, any such survey should ideally extend to earlier and later spectral types than included in the classification scheme of Ma07 in order to sample the full range of excursions undertaken by luminous evolved stars. Moreover, given the apparent LBV excursion of J013459.47+303701.0 (with V ~ 18.4) any study must also to extend to comparatively faint candiates which are currently poorly sampled.
Combined with historical data, these observations support the finding that some excursions/outbursts of luminous evolved stars may last several decades. Both J013350.12+304126.6 and B324 have spectra that resemble those of LBVs in outburst but neither have shown evidence of secular variability over the last ~20 years. Likewise M 33 Var C has yet to return to its pre-1940s quiescent state and consequently it could be argued to have been in “outburst” for ~70 yr. Indeed, it appears possible that current assumptions as to the typical timescale of LBV excursions and eruptions have been biased to shorter durations by the length of the typical astrophysical career (as well as a small sample size). If such an assertion is correct, a considerable long term observational investment will need to be made in order to understand such behaviour, and its relation to the more rapid ( ≤ yr) “outbursts” and pulsations that are exhibited by cooler transitional objects such as YHGs and RSGs (e.g. Clark et al. 2010). Finally, despite their apparent stability, both B324 and the BHG [HS80] 110A are found to exhibit combinations of temperature and luminosity which place them in excess of the HD-limit, joining a handful of other stars such as Cyg OB2 #12 that also appear to violate it; intriguingly the latter object also appears to have remained stable for over a century (Clark et al. 2012).
Online material
Appendix A: Presentation of spectroscopic data
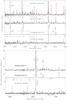 |
Fig. A.1 Optical spectra of iron stars. A spectrum of the LMC LBV R127 obtained in during outburst in 1999 July is overplotted (red dashed line) on the spectrum of J013350.12+304126.6 for comparison, after having the resolution degraded to match. |
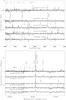 |
Fig. A.2 Optical spectra of BHGs. |
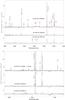 |
Fig. A.3 Optical spectra of candidate P Cygni LBVs. A high resolution spectrum of P Cygni itself is overplotted (red dashed line) on the spectrum of J013416.07+303642.1 after having the resolution degraded to match. |
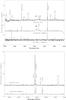 |
Fig. A.4 Optical spectra of candidate Ofpe/WNVLs. A spectrum of P Cygni is overplotted (red dashed line) on the spectrum of Romano’s star for comparison, after having the resolution degraded to match. |
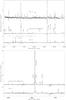 |
Fig. A.5 Optical spectra of (candidate) LBVs. Note that the spectrum of M 33 Var B dates from 2003, and the spectrum of P Cygni has been overplotted (red dashed line) for comparison, after having the resolution degraded to match. |
During the production of the paper we were informed that a similar project was also being undertaken by Phil Massey (2011, priv. comm.).
In the absence of a confirmatory spectrum we currently exclude the candidate reported by Burggraf & Weis (2008).
IRAF is distributed by the National Optical Astronomy Observatory, which is operated by the Association of Universities for Research in Astronomy, Inc., under cooperative agreement with the National Science Foundation.
Foreshadowing Sect. 5.2, no characteristic LBV like excursions are apparent in the available photometry, although the presence of a low level periodic photometric modulation (Shemmer et al. 2000) and spectroscopic radial velocity shifts lead Sholukhova et al. (2004) to propose that J013406.63+304147.8 is a short period binary.
Potentially significant nebular contamination of J013416.07+303642.1, revealed during attempts to model this star, prevents us from drawing conclusions as to variability of the Balmer series.
Limited low resolution spectroscopy from 1992, coincident with the absolute visual maximum (Szeifert 1996) is suggestive of a somewhat later B-supergiant classification. These appear not to be dominated by the Fe ii emission that characterises e.g. AG Car, HR Car or R127 during visual maximum (Stahl et al. 2001; Szeifert et al. 2003; Walborn et al. 2008), with the apparent lack of low excitation metallic photospheric lines suggesting an earlier classification than the F-supergiant spectrum demonstrated by e.g. M 33 Var B (Ma07).
The iron stars J013235.25+303017.6, J013242.26+302114.1, J013300.02+303332.4, J013406.63+304147.8 and J013426.11+ 303424.7, the Ofpe/WN9 stars J013309.14+304954.4, J013327.26+ 303909.1 and J013353.60+303851.6, the B hypergiants J013355.96+304530.6 and J013416.44+303120.8 and the P Cygni candidate J013416.07+303642.1.
J013324.62+302328.4, J013341.28+302237.2, J013422.91+ 304411.0, J013357.73+301714.2, J0134234.78+303306.6 and J013429.64+303732.1.
J013333.22+303343.4 at 8 μm, Var B at 4.5 μm, J013350.92+ 303936.9 at 3.6 μm and J013416.10+303344.9 at 4.5 μm.
Excluding the nuclear cluster source J013350.12+304126.6, reclassifying Romano’s star as a bona fide LBV and adopting a classification of iron star for N45901, N93351 and N125093 (Table 2).
The LBVs M 33 Var 83 and Var B, the iron star J013248.26+303950.4, the BHG J013424.78+303306.6 and the P Cygni star J013341.28+302237.2.
Note that identification of the most luminous of these sources as M 33 Var C in Thompson et al. (2009) is in error.
Indeed, even with longer wavelength data, the study of Object X by Khan et al. (2011) illustrates the difficulty in quantitative analysis, presenting two acceptable fits to the observed spectral energy distribution arising from the adoption of very different temperatures and chemical properties of the circumstellar dust.
Ma07 give an average E(B − V) = 0.12 for blue stars within M 33 which corresponds to ~0.15 dex in log(L ∗ ); dwarfed by the uncertainty in the temperature dependant bolometric correction.
We highlight that over the wavelength range discussed and at the S/N of our observations, the He ii 4686Å line is the sole viable temperature diagnostic that permits spectroscopically similar objects such as P Cygni (Teff ~ 18kK; Najarro 2001), J013416.07+303642.1 and Romano’s star (Teff ~ 26 kK; Figs. A.3 and A.4) to be distinguished. Spectra intended for quantitative modeling of such objects must therefore be of sufficient resolution and S/N to resolve this feature, while higher S/N observations would also permit N ii/N iii and Si iii/Si iv ionisation equilibria to be employed.
Maryeva & Abolmasov (2011) adopt a slightly smaller distance (847 kpc) implying μ = 24.64. Correcting the stellar parameters for this lower distance does not materially affect our conclusions.
We suspect the IR emission of B324 arises from a combination of photosphere+wind, although interpreting the properties of such cool stars is not possible utilising current model atmosphere codes such as CMFGEN. For example, while we were able to reproduce the photospheric absorption spectrum of the LBV Wd1-243 in the cool phase we were unable to simultaneously reproduce the emission lines originating in the stellar wind (Ritchie et al. 2009).
Acknowledgments
This research is partially supported by the Spanish Ministerio de Ciencia e Innovación (MICINN) under grants AYA2008-06166-C03-02/03, AYA2010-21697-C05-01/05 and Consolider-Ingenio 2010 project CSD2006-70 and the project of the Gobierno de Canrias PID2010119. We thank the referee for their careful reading of the manuscript which lead to significant improvement in its presentation. We also thank Chris Evans for facillitating the collaboration that led to Fabio Bresolin and Norbert Pryzbilla kindly providing their unpublished Keck/DEIMOS spectra, John Hillier for providing the CMFGEN code, Phil Massey for providing published spectra in electronic format, José Prieto for providing unpublished mid-IR data and Guy Stringfellow for providing comments on the final version. Finally, JSC would like to dedicate this paper to his new daughter, Freya, and her mother, Laura.
References
- Abbott, J. B., Crowther, P. A., Drissen, L., et al. 2004, MNRAS, 350, 552 [NASA ADS] [CrossRef] [Google Scholar]
- Anders, E., & Grevesse, N. 1989, Geochim. Cosmochim. Acta, 53, 197 [Google Scholar]
- Blöcker, T., Balega, Y., Hofmann, K.-H., et al. 1999, A&A, 348, 805 [NASA ADS] [Google Scholar]
- Bolatto, A. D., Simon, J. D., Stanimirovíc, S., et al. 2007, ApJ, 655, 212 [NASA ADS] [CrossRef] [Google Scholar]
- Bonanos, A. Z., Stanek, K. Z., Kudritzki, R. P., et al. 2006, ApJ, 652, 313 [NASA ADS] [CrossRef] [Google Scholar]
- Bonanos, A. Z., Massa, D. L., Sewillo, M., et al. 2009, AJ, 138, 1003 [NASA ADS] [CrossRef] [Google Scholar]
- Bresolin, F. 2011, ApJ, 730, 129 [NASA ADS] [CrossRef] [Google Scholar]
- Bresolin, F., Kudritzki, R.-P., Najarro, F., Gieren, W., & Pietrzyński, G. 2002, ApJ, 577, L107 [NASA ADS] [CrossRef] [Google Scholar]
- Burggraf, B., & Weis, K. 2008, ASPC, 388, 149 [NASA ADS] [Google Scholar]
- Burggraf, B., Weis, K., Bomans, D. J., & Henze, M. 2011, BSRSL, 80, 440 [Google Scholar]
- Clark, J. S., Egan, M. P., Crowther, P. A., et al. 2003, A&A, 412, 185 [NASA ADS] [CrossRef] [EDP Sciences] [Google Scholar]
- Clark, J. S., Larionov, V. M., & Arkharov, A. 2005a, A&A, 435, 239 [NASA ADS] [CrossRef] [EDP Sciences] [Google Scholar]
- Clark, J. S., Neguerueula, I., Crowther, P. A., & Goodwin, S. P. 2005b, A&A, 434, 949 [NASA ADS] [CrossRef] [EDP Sciences] [Google Scholar]
- Clark, J. S., Crowther, P. A., Larionov, V. M., et al. 2009, A&A, 507, 1555 [NASA ADS] [CrossRef] [EDP Sciences] [Google Scholar]
- Clark, J. S., Ritchie, B. W., & Negueruela, I. 2010, A&A, 514, A87 [NASA ADS] [CrossRef] [EDP Sciences] [Google Scholar]
- Clark, J. S., Arkharov, A., Larionov, V., et al. 2011a, BSRSL, 80, 361 [NASA ADS] [Google Scholar]
- Clark, J. S., Ritchie, B. W., Negueruela, I., et al. 2011b, A&A, 531, A28 [NASA ADS] [CrossRef] [EDP Sciences] [Google Scholar]
- Clark, J. S., Najarro, F., Negueruela, I., et al. 2012, A&A, 541, A145 [NASA ADS] [CrossRef] [EDP Sciences] [Google Scholar]
- Cordiner, M. A., Smith, K. T., Cox, N. L. J., et al. 2008, A&A, 492, L5 [NASA ADS] [CrossRef] [EDP Sciences] [Google Scholar]
- Corral, L. J. 1996, AJ, 112, 1450 [NASA ADS] [CrossRef] [Google Scholar]
- Crowther, P. A., Szeifert, Th., Stahl, O., & Zickgraf, F.-J. 1997, A&A, 318, 543 [NASA ADS] [Google Scholar]
- Drout, M. R., Massey, P., Meynet, G., Tokarz, S., & Caldwell, N. 2009, ApJ, 703, 441 [NASA ADS] [CrossRef] [Google Scholar]
- Egan, M. P., Clark, J. S., Mizuno, D. R., et al. 2002, ApJ, 572, 288 [NASA ADS] [CrossRef] [Google Scholar]
- Fabrika, S., Sholukhova, O., Becker, T., et al. 2005, A&A, 437, 217 [NASA ADS] [CrossRef] [EDP Sciences] [Google Scholar]
- Fitzgerald, M. P. 1970, A&A, 4, 234 [NASA ADS] [Google Scholar]
- Georgiev, L. N., Koenigsberger, G., Hillier, D. J., et al. 2011, AJ, 142, 191 [NASA ADS] [CrossRef] [Google Scholar]
- Groh, J. H., Hillier, D. J., & Damineli, A. 2009, ApJ, 698, 1698 [NASA ADS] [CrossRef] [Google Scholar]
- Gummersbach, C. A., Zickgraf, F.-J., & Wolf, B. 1995, A&A, 302, 409 [NASA ADS] [Google Scholar]
- Gvaramadze, V. V., Kniazev, A. Y., & Fabrika, S. 2010, MNRAS, 405, 1047 [NASA ADS] [Google Scholar]
- Hadfield, L. J., van Dyk, S. D., Morris, P. W., et al. 2007, MNRAS, 376, 248 [NASA ADS] [CrossRef] [Google Scholar]
- Hartman, J. D., Bersier, D., & Stanek, K. Z. 2006, MNRAS, 371, 1405 [NASA ADS] [CrossRef] [MathSciNet] [Google Scholar]
- Herrero, A., Lennon, D. J., Vilchez, J. M., Kudritzki, R. P., & Humphreys, R. H. 1994, A&A, 287, 885 [NASA ADS] [Google Scholar]
- Hillier, D. J., & Miller, D. L. 1998, ApJ, 496, 407 [NASA ADS] [CrossRef] [Google Scholar]
- Hillier, D. J., & Miller, D. L. 1999, ApJ, 519, 354 [NASA ADS] [CrossRef] [Google Scholar]
- Hubble, E., & Sandage, A. 1980, ApJS, 44, 319 [NASA ADS] [CrossRef] [Google Scholar]
- Humphreys, R. 1975, ApJ, 200, 426 [NASA ADS] [CrossRef] [Google Scholar]
- Humphreys, R. M. 1980, ApJ, 241, 587 [NASA ADS] [CrossRef] [Google Scholar]
- Humphreys, R. M., & Davidson, K. 1994, PASP, 111, 1124 [Google Scholar]
- Humphreys, R. M., Leitherer, C., Stahl, O., Wolf, B., & Zickgraf, F.-J. 1988, A&A, 203, 306 [NASA ADS] [Google Scholar]
- Humphreys, R. M., Massey, P., & Freedman, W. L. 1990, AJ, 99, 84 [NASA ADS] [CrossRef] [Google Scholar]
- Humphreys, R. M., Jones, T. J., & Polomski, E., et al. 2006, AJ, 131, 2105 [NASA ADS] [CrossRef] [Google Scholar]
- Kaufer, A., Stahl, O., Wolf, B., et al. 1996, A&A, 305, 887 [NASA ADS] [Google Scholar]
- Kehrig, C., Oey, M. S., & Crowther, P. A. 2011, A&A, 526, A128 [NASA ADS] [CrossRef] [EDP Sciences] [Google Scholar]
- Kenyon, S. J., & Gallagher, J. S. 1985, ApJ, 290, 542 [NASA ADS] [CrossRef] [Google Scholar]
- Khan, R., Stanek, K. Z., Kochanek, C. S., & Bonanos, A. Z. 2011, ApJ, 723, 43 [NASA ADS] [CrossRef] [Google Scholar]
- Koenigsberger, G., Gerogiev, L., & Hillier, D. J., et al. 2010, AJ, 139, 2600 [NASA ADS] [CrossRef] [Google Scholar]
- Lamers, H. J. G. L. M. ASPC, 83, 176 [Google Scholar]
- Lamers, H. J. G. L. M., Bastiaanse, M. V., Aerts, C., & Spoon, H. W. W. 1998a, A&A, 335, 605 [NASA ADS] [Google Scholar]
- Lamers, H. J. G. L. M., Zickgraf, F.-J., de Winter, D., Houziaux, L., & Zorec, J. 1998b, A&A, 340, 117 [NASA ADS] [Google Scholar]
- Lenorzer, A., de Koter, A., & Waters, L. B. F. M. 2002, A&A, 386, L5 [NASA ADS] [CrossRef] [EDP Sciences] [Google Scholar]
- Lobel, A., Dupree, A. K., Stefanik, R. P., et al. 2003, ApJ, 583, 923 [NASA ADS] [CrossRef] [Google Scholar]
- Maryeva, O., & Abolmasov, P. 2010, RMxAA, 46, 279 [Google Scholar]
- Maryeva, O., & Abolmasov, P. 2012, MNRAS, 419, 1455 [NASA ADS] [CrossRef] [Google Scholar]
- Massey, P., & Johnson, O. 1998, ApJ, 505, 793 [NASA ADS] [CrossRef] [Google Scholar]
- Massey, P., Armandroff, T. E., Pyke, R., Patel, K., & Wilson, C. D. 1995, AJ, 110, 2715 [NASA ADS] [CrossRef] [Google Scholar]
- Massey, P., Bianchi, L., Hutchings, J. B., & Stecher, T. P. 1996, ApJ, 469, 629 [Google Scholar]
- Massey, P., Olsen, K. A. G., Hodge, P. W., et al. 2006, AJ, 131, 2478 [NASA ADS] [CrossRef] [Google Scholar]
- Massey, P., McNeill, R. T., & Olsen, K. A. G. 2007, AJ, 134, 2474 [NASA ADS] [CrossRef] [Google Scholar]
- McQuinn, K. B. W., Woodward, C. E., Willner, S. P., et al. 2007, ApJ, 664, 850 [NASA ADS] [CrossRef] [Google Scholar]
- Monteverde, M. I., Herrero, A., Lennon, D. J., & Kudritzki, R.-P. 1996, A&A, 312, 24 [NASA ADS] [Google Scholar]
- Morel, T., Marchenko, S. V., & Pati, A. K. 2004, MNRAS, 351, 552 [NASA ADS] [CrossRef] [Google Scholar]
- Meynet, G., & Maeder, A. 2000, A&A, 361, 101 [NASA ADS] [Google Scholar]
- Najarro, F. 2001, P Cygni 2000: 400 Years of Progress, ed. M. de Groot, & C. Sterken (San Francisco, CA: ASP), ASP Conf. Ser., 233, 133 [Google Scholar]
- Najarro, F., Hillier, D. J., & Stahl, O. 1997, A&A, 326, 1117 [NASA ADS] [Google Scholar]
- Neugent, K. F., & Massey, P. 2011, ApJ, 733, 123 [NASA ADS] [CrossRef] [Google Scholar]
- Oudmaijer, R. D. 1998, A&AS, 129, 541 [NASA ADS] [CrossRef] [EDP Sciences] [Google Scholar]
- Patel, M., Oudmaijer, R. D., Vink, J. S., et al. 2008, MNRAS, 385, 967 [NASA ADS] [CrossRef] [Google Scholar]
- Petrovic, J., Langer, N., & van der Hucht, K. A. 2005, A&A, 435, 1013 [NASA ADS] [CrossRef] [EDP Sciences] [Google Scholar]
- Polcaro, V. F., Rossi, Viotti, R. F., et al. 2011, AJ, 141, 18 [NASA ADS] [CrossRef] [Google Scholar]
- Prieto, J. L. 2008, ATel., 1550, 1 [NASA ADS] [Google Scholar]
- Prieto, J. L., Kistler, M. D., & Thompson, T. A. 2008, ApJ, 681, L9 [NASA ADS] [CrossRef] [Google Scholar]
- Ritchie, B. W., Clark, J. S., Neguereula, I., & Najarro, F. 2009, A&A, 507, 1597 [NASA ADS] [CrossRef] [EDP Sciences] [Google Scholar]
- Romano, G. 1978, A&A, 67, 291 [NASA ADS] [Google Scholar]
- Sana, H., & Evans, C. J. 2011, IAUS, 272, 474 [Google Scholar]
- Schuster, M. T., Marengo, M., & Hora, J. L. 2009, ApJ, 699, 1423 [NASA ADS] [CrossRef] [Google Scholar]
- Shemmer, O., Leibowitz, E. M., & Szkody, P. 2000, MNRAS, 311, 698 [NASA ADS] [CrossRef] [Google Scholar]
- Sholukhova, O., Fabrika, S., Roth, M., & Becker, T. 2004, BaltA, 13, 156 [Google Scholar]
- Sholukhova, O. N., Fabrika, S. N., Zharova, A. V., Valeev, A. F., & Goranskij, V. P. 2011, AstBu, 66, 123 [Google Scholar]
- Shporer, A., & Mazeh, T. 2006, MNRAS,370, 1429 [NASA ADS] [CrossRef] [Google Scholar]
- Smith, N., & Owocki, S. P. ApJ, 645, L45 [Google Scholar]
- Smith, N., Humphreys, R. M., Davidson, K., et al. 2001, AJ, 121, 1111 [NASA ADS] [CrossRef] [Google Scholar]
- Smith, N., Gehrz, R. D., Hinz, P. M., et al. 2002, ApJ, 567, L77 [NASA ADS] [CrossRef] [Google Scholar]
- Spiller, F. 1992, Ph.D. Thesis, Heidelberg University [Google Scholar]
- Stahl, O., Jankovics, I., Kovacs, J., et al. 2001, A&A, 375, 54 [NASA ADS] [CrossRef] [EDP Sciences] [Google Scholar]
- Stahl, O., Gang, T., Sterken, C., et al. 2003, A&A, 400, 279 [NASA ADS] [CrossRef] [EDP Sciences] [Google Scholar]
- Stringfellow, G. S., Gvaramadze, V. V., Beletsky, Y., & Kniazev, A. Y. 2011, to appear in the conference proceedings “Four Decades of Research on Massive Stars: A Scientific Meeting in Honour of Anthony F. J. Mofft”, Laurent Drissen, Nicole St-Louis, C. Robert, A. F. J. Moffat [arXiv:1112.2686] [Google Scholar]
- Szeifert, T. 1996, in Wolf-Rayet stars in the framework of stellar evolution, ed. J. M. Vreux, A. Detal, D. Fraipont-Caro, E. Gosset, & G. Rauw (Liège: Univerite de Liège, Institut d’Astrophysique), 459 [Google Scholar]
- Szeifert, Th., Humphreys, R. M., Davidson, K., et al. 1996, A&A, 314, 131 [NASA ADS] [Google Scholar]
- Szeifert, Th., Kaufer, A., Crowther, P. A., & Stahl, O. 2003, in A Massive Star Odyssey: From Main Sequence to Supernova, ed. K. van der Hucht, A. Herrero, & C. Esteban (San Francisco, CA: ASP), Proc. IAU Symp., 212, 243 [Google Scholar]
- Thompson, T. A., Prieto, J. L., Stanek, K. Z., et al. 2009, ApJ, 705, 1364 [NASA ADS] [CrossRef] [Google Scholar]
- Urbaneja, M. A., Herrero, A., Kudritzki, R.-P., et al. 2005, ApJ, 635, 311 [NASA ADS] [CrossRef] [Google Scholar]
- Urbaneja, M. A., Herrero, A., Lennon, D. J., Corral, L. J., & Meynet, G. 2011, ApJ, 735, 39 [NASA ADS] [CrossRef] [Google Scholar]
- Valeev, A. F., Sholukhova, O., & Fabrika, S. 2009, MNRAS, 396, L21 [NASA ADS] [Google Scholar]
- Valeev, A. F., Sholukhova, O. N., & Fabrika, S. N. 2010, AstBu, 65, 381 [Google Scholar]
- van den Berg, S., Herbst, E., & Kowal, C. T. 1975, ApJS, 29, 303 [NASA ADS] [CrossRef] [Google Scholar]
- van Dokkum, P. G. 2001, PASP, 113, 1420 [NASA ADS] [CrossRef] [Google Scholar]
- van Genderen, A. M. 2001, A&A, 366, 508 [NASA ADS] [CrossRef] [EDP Sciences] [Google Scholar]
- van Leeuwen, F., van Genderen, A. M., & Zegelaar, I. 1998, A&AS, 128, 117 [NASA ADS] [CrossRef] [EDP Sciences] [Google Scholar]
- Viotti, R. F., Rossi, C., Polcaro, V. F., et al. 2006, A&A, 458, 225 [NASA ADS] [CrossRef] [EDP Sciences] [Google Scholar]
- Voors, R. H. M., Waters, L. B. F. M., de Koter, A., et al. 2000, A&A, 356, 501 [NASA ADS] [Google Scholar]
- Wachter, S., Mauerhan, J. C., van Dyk, S. D., et al. 2010, AJ, 139, 2330 [NASA ADS] [CrossRef] [Google Scholar]
- Walborn, N. R., & Fitzpatrick, E. L. 1990, PASP, 102, 379 [NASA ADS] [CrossRef] [Google Scholar]
- Walborn, N. R., & Fitzpatrick, E. L. 2000, PASP, 122, 50 [NASA ADS] [CrossRef] [Google Scholar]
- Walborn, N. R., Stahl, O., & Gamen, R. G. 2008, APJ, 683, L33 [Google Scholar]
- Wegner, W. 1994, MNRAS, 270, 229 [NASA ADS] [CrossRef] [Google Scholar]
- Wolf, B. 1989, A&A, 217, 87 [NASA ADS] [Google Scholar]
- Wolf, B., Appenzeller, I., & Stahl, O. 1981, A&A, 103, 94 [NASA ADS] [Google Scholar]
- Wolf, B., Stahl, O., Smolinski, J., & Casatella, A. 1988, A&AS, 74, 239 [NASA ADS] [Google Scholar]
- Zickgraf, F.-J., Wolf, B., Stahl, O., Leitherer, C., & Klare, G. 1985, A&A, 143, 421 [NASA ADS] [Google Scholar]
- Zickgraf, F.-J., Wolf, B., Stahl, O., Leitherer, C., & Appenzeller, I. 1986, A&A, 163, 119 [NASA ADS] [Google Scholar]
- Zickgraf, F.-J. 2006, in Stars with the B[e] phenomenon (San Francisco, CA: ASP), ASP Conf. Ser., 355, 211 [Google Scholar]
All Tables
All Figures
|
Fig. 1 Multiepoch optical spectra of selected stars. Top panel – illustrative Iron stars and bottom panel – the P Cygni LBV J013416.07+3-3642.1 and the B hypergiant J013416.44+303120.8. |
| In the text | |
|
Fig. 2 Multiepoch optical spectra of selected LBVs. Top panel – the P Cygni star J013339.52+304540.5; note that the 2010 spectrum is reproduced in Fig. A.3, where weak Si iii, O ii and C iii absorption features are visible. Bottom panel – the bona fide LBV M 33 Var C, with the spectrum of the cool F0-5Ia+ hypergiant B324 overlayed (Monteverde et al. 1996, and Sect. 5.3.2). |
| In the text | |
|
Fig. 3 Sloan g′ and (g′ − i′) colour index plotted against time for the candidate LBVs J013426.11+303424.7 and J013459.47+303701.0. Data from Hartman et al. (2006). |
| In the text | |
|
Fig. 4 V band photometry of M 33 Var C from Shporer & Mazeh (2006), with the timing of the spectroscopic observation discussed in Sect. 3.5 indicated. |
| In the text | |
|
Fig. 5 Colour magnitude plots for (candidate) LBVs within M 33, following the ammended classification scheme of Ma07. Stars associated with hot dust are identified in Sect. 4.2. Note that Massey et al. (1996) associate the brightest object, J013350.92+303936.9 (=UIT218), with the galactic nucleus – an apparently composite source with an F Ia spectral type rather the hot LBV classification given in Ma07 – while J013242.26-301214.1 lacks an (R − I) indice. |
| In the text | |
|
Fig. 6 Mid-IR colour magnitude plot of stellar point sources within M 33. Related dusty, high mass loss rate massive evolved objects within M 33 and the Galaxy also plotted for comparison (filled and empty black circles respectively). See Sect. 4.2 for origin of individual data points. Note that J013350.92 = 303936.9 (=UIT218) is associated with the galactic nucleus and is likely a composite source. |
| In the text | |
|
Fig. 7 Mid-IR colour colour plot of candidate LBVs and related stars within M 33, with the massive stellar population of the Large Magellanic Cloud shown for comparison (data from Bonanos et al. 2009). The outlying LMC WC star with [3.6] – [4.5] ~ 0.94 is the heavily reddened triple system BAT99-38, while the LMC LBV with [4.5] – [8.0] ~ 2.5 is R71. |
| In the text | |
|
Fig. 8 Comparison of the synthetic spectrum (dashed) to the 2010 Sept. observations (solid) of Romano’s star. |
| In the text | |
|
Fig. 9 Comparison of the 1996 spectrum of the emission line F hypergiant B324 (solid line; Monteverde et al. 1996) against the Galactic YHG IRC +10 420 degraded to a comparable spectral resolution (red dotted line; Oudmaijer et al. 1998). Similar Fe ii P Cygni emission lines are also observed in the 2003 spectrum of M 33 Var C. |
| In the text | |
|
Fig. A.1 Optical spectra of iron stars. A spectrum of the LMC LBV R127 obtained in during outburst in 1999 July is overplotted (red dashed line) on the spectrum of J013350.12+304126.6 for comparison, after having the resolution degraded to match. |
| In the text | |
|
Fig. A.2 Optical spectra of BHGs. |
| In the text | |
|
Fig. A.3 Optical spectra of candidate P Cygni LBVs. A high resolution spectrum of P Cygni itself is overplotted (red dashed line) on the spectrum of J013416.07+303642.1 after having the resolution degraded to match. |
| In the text | |
|
Fig. A.4 Optical spectra of candidate Ofpe/WNVLs. A spectrum of P Cygni is overplotted (red dashed line) on the spectrum of Romano’s star for comparison, after having the resolution degraded to match. |
| In the text | |
|
Fig. A.5 Optical spectra of (candidate) LBVs. Note that the spectrum of M 33 Var B dates from 2003, and the spectrum of P Cygni has been overplotted (red dashed line) for comparison, after having the resolution degraded to match. |
| In the text | |
Current usage metrics show cumulative count of Article Views (full-text article views including HTML views, PDF and ePub downloads, according to the available data) and Abstracts Views on Vision4Press platform.
Data correspond to usage on the plateform after 2015. The current usage metrics is available 48-96 hours after online publication and is updated daily on week days.
Initial download of the metrics may take a while.