Free Access
Fig. A.5
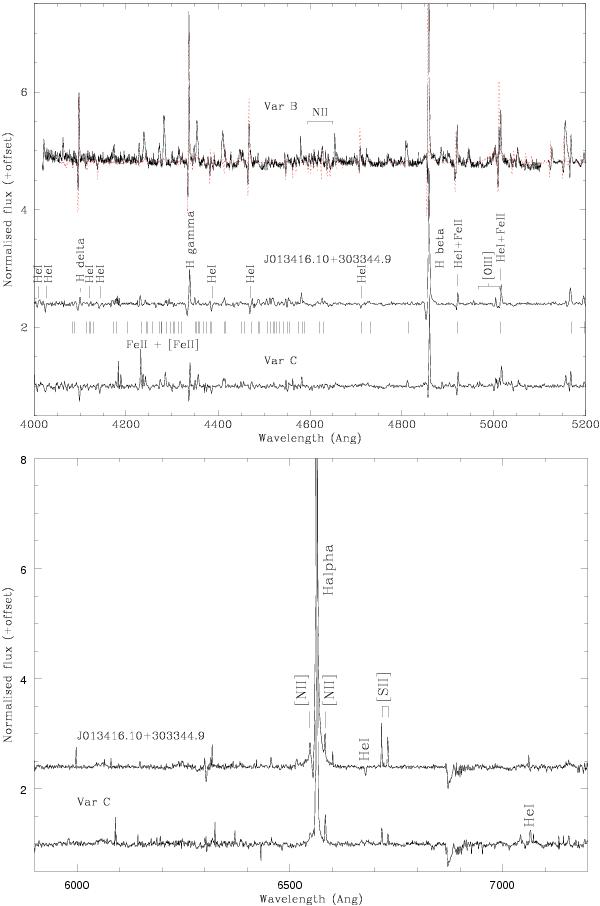
Optical spectra of (candidate) LBVs. Note that the spectrum of M 33 Var B dates from 2003, and the spectrum of P Cygni has been overplotted (red dashed line) for comparison, after having the resolution degraded to match.
This figure is made of several images, please see below:
Current usage metrics show cumulative count of Article Views (full-text article views including HTML views, PDF and ePub downloads, according to the available data) and Abstracts Views on Vision4Press platform.
Data correspond to usage on the plateform after 2015. The current usage metrics is available 48-96 hours after online publication and is updated daily on week days.
Initial download of the metrics may take a while.