| Issue |
A&A
Volume 541, May 2012
|
|
|---|---|---|
| Article Number | A146 | |
| Number of page(s) | 22 | |
| Section | Stellar structure and evolution | |
| DOI | https://doi.org/10.1051/0004-6361/201118440 | |
| Published online | 17 May 2012 | |
Online material
Appendix A: Presentation of spectroscopic data
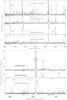 |
Fig. A.1
Optical spectra of iron stars. A spectrum of the LMC LBV R127 obtained in during outburst in 1999 July is overplotted (red dashed line) on the spectrum of J013350.12+304126.6 for comparison, after having the resolution degraded to match. |
| Open with DEXTER | |
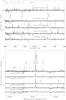 |
Fig. A.2
Optical spectra of BHGs. |
| Open with DEXTER | |
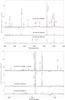 |
Fig. A.3
Optical spectra of candidate P Cygni LBVs. A high resolution spectrum of P Cygni itself is overplotted (red dashed line) on the spectrum of J013416.07+303642.1 after having the resolution degraded to match. |
| Open with DEXTER | |
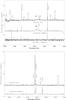 |
Fig. A.4
Optical spectra of candidate Ofpe/WNVLs. A spectrum of P Cygni is overplotted (red dashed line) on the spectrum of Romano’s star for comparison, after having the resolution degraded to match. |
| Open with DEXTER | |
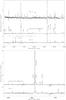 |
Fig. A.5
Optical spectra of (candidate) LBVs. Note that the spectrum of M 33 Var B dates from 2003, and the spectrum of P Cygni has been overplotted (red dashed line) for comparison, after having the resolution degraded to match. |
| Open with DEXTER | |
© ESO, 2012
Current usage metrics show cumulative count of Article Views (full-text article views including HTML views, PDF and ePub downloads, according to the available data) and Abstracts Views on Vision4Press platform.
Data correspond to usage on the plateform after 2015. The current usage metrics is available 48-96 hours after online publication and is updated daily on week days.
Initial download of the metrics may take a while.