| Issue |
A&A
Volume 541, May 2012
|
|
|---|---|---|
| Article Number | A76 | |
| Number of page(s) | 17 | |
| Section | Interstellar and circumstellar matter | |
| DOI | https://doi.org/10.1051/0004-6361/201118126 | |
| Published online | 01 May 2012 | |
Surface chemistry in the interstellar medium⋆
I. H2 formation by Langmuir-Hinshelwood and Eley-Rideal mechanisms
LUTH, Observatoire de Paris, CNRS, Université Paris Diderot, 5 place Jules Janssen, 92190 Meudon, France
e-mail: This email address is being protected from spambots. You need JavaScript enabled to view it.
Received: 20 September 2011
Accepted: 30 January 2012
Abstract
Context. It has been found from ISO, Spitzer, and Herschel observations that molecular hydrogen, H2, can form on warm grains. Numerical models of interstellar chemistry have failed to reproduce the observed formation rates of H2, which remains a difficulty when interpreting observations of photon-dominated regions (PDRs).
Aims. We attempt to include as much experimental and theoretical information as possible to describe H2 formation in astrophysical environments to solve this problem.
Methods. We modified our “Meudon PDR code” to include a detailed treatment of H2 formation mechanisms including: i) the Langmuir-Hinshelwood mechanism taking into account the contribution of the different sizes of dust grains in the diffusion processes; and ii) the Eley-Rideal mechanism.
Results. We are able to form H2 even in regions where the dust temperature is higher than 25 K. We also show that formation by the Eley-Rideal mechanism can be a significant source of gas heating. We derive line intensities for various astrophysical conditions.
Conclusions. Our approach results in a higher H2 formation rate than for the “standard” 3 × 10-17 nH n(H) cm3 s-1 expression.
Key words: astrochemistry / ISM: molecules / ISM: clouds / ISM: general
Appendices are available in electronic form at http://www.aanda.org
© ESO, 2012
1. Introduction
Despite the general agreement that H2 formation occurs on grain surfaces, the actual formation mechanisms at work in interstellar conditions remain unclear. In this paper we present a new chemical model of H2 formation that encompasses recent laboratory experimental and theoretical results on this topic and show some consequences of the model results. A follow-up paper will extend these results to other molecules on grains. We recall in Sect. 2 the previous assumptions concerning H2 formation, in relation to observational issues. Section 3 describes two new implementations concerning i) the contribution of different dust grain sizes to the formation process within the Langmuir-Hinshelwood mechanism (labeled LH in the following), ii) the introduction of the Eley-Rideal mechanism (labeled ER) for H2 formation. In Sect. 4 we display and compare the results obtained for different pressures and radiation fields in pertaining to both diffuse gas and dense photon dominated regions (PDRs) conditions. Particular focus is placed on the values of the H2 formation rates themselves and on observational tests such as the emissivities of fine structure transitions of the abundant atoms and ions and infrared H2 transitions. We present our conclusions in Sect. 5.
Dust properties.
2. Historical status
2.1. H2 formation efficiency
Hollenbach & Salpeter (1971) estimated the binding energies of H and H2 on various surfaces as well as the corresponding sticking efficiencies and subsequently developed the first theory of the formation mechanism of H2 on dust grain surfaces in interstellar conditions by diffusion of H atoms on the surface of the grains. The formation rate was subsequently derived thanks to Copernicus far ultraviolet observations of H2 in absorption in diffuse interstellar clouds (Jura 1974). This mean formation rate, confirmed by FUSE observations (Gry et al. 2002), is 3 × 10-17 nH n(H) cm3 s-1. The launch of the ISO satellite and the development of infrared astronomy using ground-based telescopes has allowed detections of warm excited H2 via its electric quadrupolar transitions in the infrared in PDRs. At long wavelengths (~7−28 μm) pure rotational transitions take place and are detected from space, whereas rovibrational transitions at shorter wavelengths can be observed from the ground in the I, J, H, and K photometric bands. Le Bourlot et al. (1995b) showed that this reaction rate coefficient can be readily expressed in terms of the dust grain properties, i.e. density ρgr, dust-to-gas mass ratio G, and the minimum (amin) and maximum (amax) values of the grain radii, for which the size distribution is a power-law dngr = Agr a-3.5 da (Mathis et al. 1977), subsequently quoted as the MRN distribution. Le Bourlot et al. (1995b) derived the normalization factor 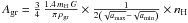 and the formation rate of H2
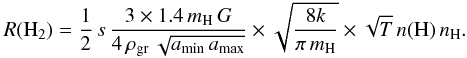 This expression includes a sticking coefficient s for impinging hydrogen atoms, the mass of atomic hydrogen mH, the Boltzmann constant k, and the gas temperature T. For typical dust properties (Table 1), this expression becomes
  . Assuming that the sticking factor is 1 up to 10 K and then decreases with temperature as
  , the formation rate becomes equal to 4.4 × 10⁻¹⁷ nH n(H) cm3 s-1. We note that if we take a single radius of grains with a value of 0.1 μm, the formation rate is now 1.3 × 10⁻¹⁷ nH n(H) cm3 s-1. The present prescription also allows us to derive the mean-cross section per H atom
 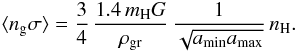 For the standard parameters, the corresponding value is 1.95 × 10⁻²¹ nH.
While this simple physical picture reflects the coherence between the observations and the basic properties of dust, a new perspective arose when the quantitative values of the desorption and diffusion barriers were obtained from temperature desorption experiments reported by Katz et al. (1999); Biham et al. (2001); Biham & Lipshtat (2002); Lipshtat & Biham (2003) and Lipshtat et al. (2004) with various types of surfaces. The corresponding values are reported in Table 1 and compared to older values from Hasegawa et al. (1992). These values were included in theoretical models of H2 formation by Biham & Lipshtat (2002), who also discussed the relevance of using the rate equations formalism within the LH diffusion mechanism. In the case of small grains, Biham & Lipshtat (2002) argue that only a few hydrogen atoms can stick to the surface so that master equations describing the various probabilities of having N adsorbed H atoms are required. This formalism leads to a large number of coupled equations. Biham & Lipshtat (2002) further introduced the use of moment equations, reducing the number of equations and leading, in the case of H2 formation, to only two coupled equations. This procedure compares very satisfactorily with the master equation solution (Biham et al. 2005). During the diffusion process, physisorbed H atoms explore the available adsorption sites with a sweeping rate 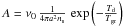 , where ν0 is a typical vibration frequency and Td = Ed/k the diffusion energy threshold in Kelvin. The number of available sites, 4πa2ns, depends on the radius of the grain. The sweeping rate probability was subsequently revisited by Lohmar & Krug (2006) and Lohmar et al. (2009) for various surface geometries.The desorption probability is assumed to follow a similar exponential decrease
  with the same ν0 frequency but the binding energy in Kelvin Tb = Eb/k.
The frequency ν0 is often assumed to be equal to 1012 s-1 (Biham et al. 2001). Hasegawa et al. (1992) introduced the vibrational frequency corresponding to an harmonic oscillator within the binding well potential of the form  . The usual expression is
  where the force constant
  at the minimum of the interaction potential U(r). The last expression defines a typical size of the bottom of the well d0 by identification with the expression of Hasegawa et al. (1992). Kim et al. (2011) and Sakong & Kratzer (2010) showed that the stretching vibration wavenumber of H on graphene is about 2600 cm-1, and the bending about 1200 cm-1. This translates to vibrational frequencies of a few 1013 s-1, which are rather higher than usual estimates. We deduced a typical size of d0 ~ 1 Å . The corresponding values of
  are given in Table 1 for various dust compositions.We verified that model results are almost insensitive to the value of ν0.
Le Petit et al. (2009) included the possibility of the rejection of the impinging hydrogen atoms, when they land on an already occupied site, and introduced these mechanisms into the Meudon PDR code together with the size distribution of grains, while assuming a uniform dust temperature for all grain sizes.
The net result, for H2 formation, is that the reaction is only efficient for a narrow window of dust temperatures, ranging typically from 11 K to 19 K, depending on the values of desorption and diffusion barriers, as also pointed out by Chang et al. (2006). This restricted range of grain temperatures is difficult to reconcile with H2 observations towards dense PDRs (Habart et al. 2004, 2005; Cazaux & Tielens 2004, 2010; Habart et al. 2011), where the dust temperatures reach values close to and even higher than 30 K. As a result, new scenarios have been proposed such as the reaction between a physisorbed and a chemisorbed atom (Habart et al. 2004) or reactions between two chemisorbed atoms (Cazaux & Tielens 2004, 2010).
Other attempts to improve the physics describing the actual process have considered morphological aspects of the dust grain surfaces, such as roughness effects probed through continuous-time random-walk Monte Carlo simulation studies, resulting in effective formation-rate coefficients that depend on the surface temperature and impinging atomic flux (Chang et al. 2006). In summary, despite the large number of laboratory and theoretical studies that have been completed on this subject, a detailed description of H2 formation is still missing. As a consequence, several authors (Hollenbach et al. 2009; Islam et al. 2010; Kaufman et al. 2006; Sheffer et al. 2011) prefer to use an ad hoc “standard” value of 3 × 10-17 nH n(H) cm3 s-1, determined by Copernicus and FUSE observations for diffuse clouds, and/or introduce an additional multiplication factor of two for dense and bright PDRs.
2.2. H2 excitation in the formation process
The excitation state of H2 in the formation process is another concern. Experimental studies (Hornekær et al. 2003; Islam et al. 2007; Latimer et al. 2008; Lemaire et al. 2010) demonstrated that H2 can be rovibrationally excited in the formation process, where the experiments were conducted with two beams of H and D and various types of surfaces. These experiments were performed on cold surfaces, indicating that the formation mechanism involves mainly physisorbed atoms, so a LH mechanism. Alternatively, Farebrother et al. (2000); Bachellerie et al. (2009); Sizun et al. (2010) performed theoretical calculations for the ER formation mechanism of H2 on graphenic surfaces and derived the rovibrational excitation of the nascent H2 molecule for different energies of the impinging hydrogen atoms. The most recent study of Sizun et al. (2010) included explicitly the role of the zero point energy, which leads to a slight increase in the rotational excitation within v = 5 and 6. In the astrophysical community, Duley & Williams (1993) proposed that infrared fluorescence of H2 could be detected towards dark clouds, as a signature of its formation process. Le Bourlot et al. (1995a) showed that the excitation due to the secondary electrons generated by cosmic rays was much more efficient, even for the standard value of the cosmic ionization rate. Similar conclusions were reached by Islam et al. (2010) in a detailed modeling study including the most recent experimental information on the excitation of H2 and assuming however the “standard” formation rate of 3 × 10-17 nH n(H) cm3 s-1. Congiu et al. (2009) also found that internal excitation is quenched before desorption from experiments involving amorphous water ice. However, formation pumping signatures can also be searched for in PDRs and were reported as such by Burton et al. (2002) in the Messier 17 PDR through the mapping of the 6–4 O(3) infrared transition of H2 at 1.733 μm. We investigate the possible consequences of this result in our present study.
3. Model calculations
Le Petit et al. (2009) studied the efficiency of H2 formation for different dust temperatures when H2 formation takes place on amorphous carbon, assuming that the grains have the same temperature, independently of their size. This hypothesis is inadequate as discussed by different authors (Cuppen et al. 2006). Compiègne et al. (2011) explicitly computed the dust temperatures resulting from the balance between photoelectric effects and radiative infrared emission for the different grain sizes. The results are very close to the analytic expressions given by Hollenbach et al. (1991) and used in the Meudon PDR code (Le Petit et al. 2006). We describe now two major extensions, i.e. inclusion of the different dust grain temperatures for surface reactions involving physisorbed hydrogen atoms and the introduction of the ER mechanism for H2 formation. Other recent updates of the PDR code are described in Appendix A.
3.1. Langmuir-Hinshelwood mechanism
In a pure diffusion process (LH mechanism), physisorbed hydrogen atoms, labelled as “H:”, can either diffuse on the surface, encounter another physisorbed hydrogen atom to form H2 or leave the surface through thermal desorption or another desorption process such as photodesorption. We derived the detailed rate equations in Appendix B, taking into account size-dependent dust temperatures and rejection effects. The formation rate of H2 is no longer analytic and involves a numerical integration over the dust grain sizes. In this paper, we assume a MRN distribution law, but the expressions are given for any distribution. The number of particles X physisorbed on the surface of a grain of size a is NX:(a) and is one of the unknowns we have to compute.
Considering only the balance between H and H2 (without deuterium here), we can derive, as shown in Appendix B, Eqs. (B.2) and (B.4) ![Mathematical equation: \begin{eqnarray*} \frac{{\rm d}[\mathrm{H}]}{{\rm d}t}=-k_{\rm rej}\,\frac{S_{\rm gr}}{d_{\rm s}^{2}}\,[\mathrm{H}]+k_{\rm rej}\,[\mathrm{H}]\,\int_{a_{\rm min}}^{a_{\rm max}}\,\left(N_{\mathrm{H:}}(a)+N_{\mathrm{H}_{2}:}(a)\right)\, {\rm d}n_{\rm g} \end{eqnarray*}](/articles/aa/full_html/2012/05/aa18126-11/aa18126-11-eq96.png)
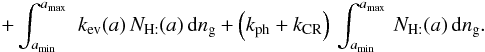 In this expression, krej, kev, kph, and kCR are the chemical reaction rate constants holding respectively for rejection, thermal evaporation, photo-desorption, and cosmic-ray-induced desorption. The parameter krej is proportional to both the thermal velocity of the impinging hydrogen atoms and the sticking coefficient, which is also a function of the gas temperature. The parameter Sgr, the total grain surface per cubic centimeter, is equal to
 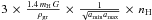 , for the MRN distribution law, and ds is the mean distance between adsorption sites. Among the ejection processes, only thermal evaporation (kev(a)) depends on the grain size. The formation of gas phase H2 is assumed to occur directly after the encounter of adsorbed hydrogen atoms. The corresponding rate is given by Eq. (B.6)
 ![Mathematical equation: \begin{eqnarray*} \frac{{\rm d}[\mathrm{H}_{2}]}{{\rm d}t}=\frac{{\rm d}_{\rm s}^{2}}{4\pi}\,\int_{a_{\rm min}}^{a_{\rm max}}\,\frac{1}{t_{\mathrm{H}}(a)}\,\frac{1}{a^{2}}\, N_{\mathrm{H:}}^{2}(a)\, {\rm d}n_{\rm g}. \end{eqnarray*}](/articles/aa/full_html/2012/05/aa18126-11/aa18126-11-eq106.png) The hoping time tH depends on both diffusion and possible tunneling. The diffusion time, tD, equal to
The hoping time tH depends on both diffusion and possible tunneling. The diffusion time, tD, equal to  , now depends on the size of the grain. The tunneling time is derived for a rectangular barrier of height Eb and width ds1, where
 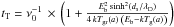 and λD is the de Broglie length, given by
  . The total hoping frequency
  is a function of the grain size.
To include these equations in the chemical scheme, the mean number of H or H2 physisorbed on a grain of size a, namely NH:(a) and NH2:(a) have to be computed. We obtain from Eqs. (B.1), (B.3) and (B.5): ![Mathematical equation: \begin{eqnarray*} \frac{{\rm d}N_{\mathrm{H:}}(a)}{{\rm d}t}&=&k_{\rm ad}(a)\,[\mathrm{H}]-k_{\rm rej}\,[\mathrm{H}]\,\left(N_{\mathrm{H:}}(a)+N_{\mathrm{H}_{2}:}(a)\right) \\ && -\left(k_{\rm ev}(a)+k_{\rm ph}+k_{\rm CR}\right)\, N_{\mathrm{H:}}(a)-\frac{1}{t_{\mathrm{H}}(a)}\,\frac{d^{2}}{4\pi\, a^{2}}\, N_{\mathrm{H:}}^{2}(a) \end{eqnarray*}](/articles/aa/full_html/2012/05/aa18126-11/aa18126-11-eq116.png)
![Mathematical equation: \begin{eqnarray*} \frac{{\rm d}N_{\mathrm{H}_{2}:}(a)}{{\rm d}t}&=&k_{\rm ad}(a)\,[\mathrm{H}_{2}]-k_{\rm rej}\,[\mathrm{H}_{2}]\,\left(N_{\mathrm{H:}}(a)+N_{\mathrm{H}_{2}:}(a)\right) \\ && -\left(k_{\rm ev}(a)+k_{\rm ph}+k_{\rm CR}\right)\, N_{\mathrm{H}_{2}:}(a) \end{eqnarray*}](/articles/aa/full_html/2012/05/aa18126-11/aa18126-11-eq117.png) where kad is the chemical rate constant for adsorption. After discretization of the grain size distribution, the equations can be solved as ordinary rate equations and are thus easy to incorporate within the other chemical rate equations. However, the number of variables grows significantly.
where kad is the chemical rate constant for adsorption. After discretization of the grain size distribution, the equations can be solved as ordinary rate equations and are thus easy to incorporate within the other chemical rate equations. However, the number of variables grows significantly.
3.2. Eley-Rideal mechanism
We explicitly introduce adsorption of H atoms onto chemisorbed sites in the PDR model. They are denoted H::. We introduce also the subsequent reactions with impinging gas-phase atomic hydrogen leading to H2 formation. This process has been studied theoretically by different authors, who have derived the interaction potential with the surface and the reaction probabilities. The static properties, potential well, and possible barrier height depend significantly on the nature of the surface, which allows some liberty in the choice of the actual value to be used in the modeling.
There is a significant difference from the adsorption process described previously, as trapping a gas-phase hydrogen atom into a chemisorption site involves the crossing of a barrier where the exponential term now involves the gas temperature. Given the variety of grain types and surfaces properties found in the ISM, it is probable that this barrier is not unique. Those properties are poorly known and trying to derive a detailed model would, arbitrarily, increase the number of free parameters. Therefore we limit ourselves to a simple approximation that takes into account the major aspects of this process.
With the assumption that H is removed from a chemisorption site only by the formation of a molecule and using results from Appendix C, Eq. (C.2), the H2 formation rate becomes ![Mathematical equation: \begin{equation} \left.\frac{{\rm d}[\mathrm{H}_{2}]}{{\rm d}t}\right|_{\rm ER}=v_{\rm th}\, \langle n\sigma_{\rm gr}\rangle\,\frac{\alpha(T)\,\exp\left(-\frac{T_{1}}{T}\right)}{1+\alpha(T)\,\exp\left(-\frac{T_{1}}{T}\right)}\,[\mathrm{H}]=k_{\rm ER}\,[\mathrm{H}]\, n_{\mathrm{H}}, \label{eq:k_ER} \end{equation}](/articles/aa/full_html/2012/05/aa18126-11/aa18126-11-eq121.png) (1)where α(T) is an efficiency factor that depends on the gas temperature T and ⟨ nσgr ⟩ is the total surface of grains available per cubic centimeter (see the Appendix for a discussion about the parameters). If a more complicated set of species and reactions is used (e.g., formation of HD), then the equations given allow the computations of all necessary abundances, but the rate is no longer analytic.
(1)where α(T) is an efficiency factor that depends on the gas temperature T and ⟨ nσgr ⟩ is the total surface of grains available per cubic centimeter (see the Appendix for a discussion about the parameters). If a more complicated set of species and reactions is used (e.g., formation of HD), then the equations given allow the computations of all necessary abundances, but the rate is no longer analytic.
The corresponding rate is  with the standard values displayed in Table 1. We note that the numerical factor is twice the value reported in Sect. 2.1 as H2 is now produced from the collision between two different partners, a gas-phase H atom and a chemisorbed H::. The order of magnitude of this chemical rate constant is again within the “standard” value derived by Jura (1974). The actual value of kER depends on both the chemisorption barrier T1 and the sticking efficiency α(T) but not the distance between adsorption sites. The influence of T1 and α(T) on the formation efficiency and line intensities is discussed in Appendix C.
We see below that this reaction has a major effect on the thermal balance at the edge of the cloud as each H2 formation process as well as each destruction contributes to the gas heating. This is thus a very efficient way to couple the strong ultraviolet radiation field to the gas.
3.3. Excitation during formation
The H2 formation process releases about 4.5 eV. Most current prescriptions assume an equipartition of this energy between the translational energy, the H2 internal energy, and the heating of the grain. In this way, about 17 000 K is spread in H2 rovibrational states. Alternative scenarios were proposed by Black & van Dishoeck (1987). Recent experimental results obtained for cold graphitic surfaces (Islam et al. 2010) and silicates (Lemaire et al. 2010) show that high vibrational levels are preferentially populated in the formation process.
The Meudon PDR code permits us to choose between several scenarios. In this paper, for the LH mechanism, we adopt the default option in which one third of the formation enthalpy is spread in internal energy with a Boltzmann distribution among rovibrational levels (see the description in Le Petit et al. 2006). We note that this is physically relevant only if a sufficient number of levels of H2 are included in the computations, even if their steady-state populations are negligible.
For the ER process, we follow the energy distribution obtained by Sizun et al. (2010, their Table 1) and consider that the uncertainties are larger than the differences that they computed at incident energies of 15 meV and 50 meV for the impinging H atom. The energy available after formation of a H2 molecule is thus split into:
-
0.3 eV (~3500 K): depth of the chemical bound potential well;
-
2.7 eV (~31 300 K): internal energy, spread following a Boltzmann distribution (mean level: v ~ 5, J ~ 6);
-
0.6 eV (~7000 K): translational kinetic energy (heating term for the gas);
-
1 eV (~11 600 K): heating of the grain.
We note that this last term is not yet included in the thermal balance of the grains.
3.4. Heating
This enhanced formation rate at the edge of PDRs provides a new contribution to the gas heating. At the edge of clouds, since the H2 photodissociation rate is important and the ER mechanism is efficient, the formation-destruction cycle of H2 has a short timescale. Each destruction by a UV photon leads to about 0.6 eV of kinetic energy, but each subsequent formation event also provides a way to tap the formation enthalpy reservoir. As seen above (Sect. 3.3), most of this energy is in high lying rovibrational levels. Hence, one H2 formation event is usually followed by the emission of an IR photon, which may be detected. However, for high enough densities, collisional deexcitation with atomic H comes into competition with spontaneous radiative decay. Above a critical density, the collisional process dominates2 and the released kinetic energy provides an efficient heating mechanism. This may lead to gas temperatures in the range of a few thousands, which further increases the formation rate (which is proportional to vth, see Eq. (1)), decreases the cycling timescales, and enhances yet further the heating rate.
This positive loop is quenched, our sticking coefficient decreasing to zero with increasing temperature, which allows an equilibrium temperature to be reached.
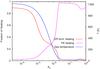 |
Fig. 1 Respective weight of ER H2 formation and photo-electric heating in a high-density PDR. Here the density is nH = 106 cm-3 and the radiation field G0 = 103. The temperature profile is fixed and has been explicitly chosen to illustrate the importance of ER heating at high temperature. |
For a high density and a high radiation field, this process is by far the dominant one at the edge of the cloud. Figure 1 shows the fraction of heating provided by the ER H2 formation versus the photo-electric effect in a cloud where the temperature profile is fixed. Close to the edge, the high gas temperature allows the ER process to be fast and most of the heating comes from collisional de-excitation. Once the temperature drops, that process is quenched and photo-electric heating dominates as long as the optical depth is not too high.
The transition region is chemically very active (H and H2 both being abundant, and the temperature still being quite high). The formation rates of molecules such as OH or CH + may be enhanced in particular if H2 internal energy can contribute to overcome the energy thresholds of the chemical reaction. Heat released by exothermic reactions also provides most of the heating missing from the two processes of Fig. 1.
4. Model results
We study the effect of different prescriptions for molecular hydrogen formation on grains. We model isobaric clouds since this is the simplest equation of state for dilute gas in a steady state embedded in a stationary environment where gravitation is negligible: large pressure variations (such as found in a constant density cloud with large temperature variations) would lead to some kind of relaxation. Smaller entities (clumps, filaments, etc.) may be better described as isochoric clouds within these large structures. A grid of these isochoric models, with the same physics as the isobaric models presented below has also been produced. They are not discussed in this paper but can be found in the PDR Data Base (http://pdr.obspm.fr).
Models labelled “A” correspond to a fixed formation rate of molecular hydrogen of 3 × 10-17 cm3 s-1, following the prescriptions of Hollenbach et al. (2009) and Islam et al. (2010); in models “B”, H2 is formed only by LH mechanism, and in models “C” both the LH and ER mechanisms are activated to form H2. The model geometry is a plane parallel infinite slab with an isotropic radiation field impinging on both sides.
We explore a large domain of gas pressure and intensity of the incident UV radiation field. The gas pressure is given by P = n × T = [n(H) + n(H2) + n(He)] × T. The radiation field is scaled versus the ISRF evaluated by Mathis et al. (1983) in the UV and visible part of the spectra. Longward of ~6000 Å the ISRF is corrected using the infrared observations of Hauser et al. (1998, Boulanger & Gonzalez, priv. comm.). The scaling factor χ is applied only to the VUV range, from 13.6 eV to 5.17 eV (corresponding to the wavelength range 912 Å to 2400 Å ) to mimic the presence of nearby bright OB stars. It represents the scaling factor of the UV part of the radiation field at a point that receives the radiation field from 4π steradians.
Grain parameters and elemental abundances, where Fe represents a generic metallic ion.
Dust properties, elemental abundances (where {X} represents the total abundance of the X element), and other parameters are given in Tables 1 and 2. The adopted dust extinction curve corresponds to the parameters of Fitzpatrick & Massa (1990) for the Galaxy. The photodissociation probabilities of H2 and CO are explicitly computed from the different discrete photodissociating transitions. We include a turbulent component to the thermal line width and take a common value of 3 km s-1 for all transitions. We choose to display results of isobaric models with values relevant to both diffuse and dense gas.
4.1. Diffuse gas
The chemical network includes only gas phase processes, except for H and H2 as well as the neutralization of atomic ions onto grain surfaces. It involves 131 chemical species and about 2650 chemical reactions. The analysis of the UV absorption of neutral carbon lines towards a sample of translucent and diffuse line of sights (Jenkins & Shaya 1979; Jenkins & Tripp 2001, 2007) allows us to derive the range of thermal pressures relevant to the Galactic interstellar gas. Table 3 displays results for two isobaric chemical models corresponding to a total visual magnitude  and χ = 1 on both sides of the cloud. The impinging flux at the edge is about 0.56 times the Mathis field as some photons are coming from the opposite side of the cloud or are back-scattered by dust. The corresponding radiation pressure at the edge is u/3, where u is the energy density per unit volume, i.e. 1.7 × 10⁻¹⁴ dynes cm-2, always smaller than the considered thermal pressures (respectively 4.14 × 10⁻¹³ and 1.38 × 10⁻¹² dynes cm-2). The size in pc is noted l (see conversion in Appendix D). The grain temperatures depend only on the radiation field intensity. Their common values at the edge of the clouds span a range between 10.7 K and 12.5 K.
We note that the results are typical of cold neutral medium (CNM) properties, following Wolfire et al. (1995). We also find that the dependence of the displayed quantities depend marginally on the assumed formation scenario of molecular hydrogen. This results directly from the range of gas and dust temperatures and the assumed dust size distribution. Thus, in diffuse clouds, the role of the ER mechanism is negligible except at the edge of the low pressure models (P = 3 × 10³ (cm-3 K) = 4.14 × 10⁻¹³ dynes cm-2). We also report T01, the excitation temperature derived from the computed column densities of H2 in levels J = 0 and J = 1: T01 = 170.5/log (9 N0/N1). The values agree with the observations (T ≃ 67 K from FUSE observations, Burgh et al. 2007; Rachford et al. 2009; and Sheffer et al. 2008), especially for models with P = 3 × 103 cm-3 K. For the low pressure models, we note that H2 formation is enhanced in models B and C compared to model A leading to a significantly higher value of the molecular fraction. The FUSE survey of diffuse clouds (Rachford et al. 2009) has not detected clouds with a molecular fraction over 0.6. This is one of the difficulties in reconciling models of diffuse clouds and observations. First, molecular fractions determined by observations also include the atomic hydrogen content over the full line of sight. Second, the molecular fraction depends strongly on the size of the clouds and the UV illumination. The detailed study is beyond the scope of this paper.
Model results for diffuse clouds conditions.
Model results for P = 105 cm-3 K and three different radiation field enhancements.
4.2. Dense PDRs
Dense and bright PDRs offer the opportunity to detect infrared transitions of molecular hydrogen and fine structure transitions of neutral and ionized atoms (O, C, C + etc.), which are then used to derive the relevant physical conditions by the observers. We again consider isobaric models irradiated on the observer side by three different radiation fields, respectively 102, 103, and 104 times the standard interstellar radiation field of Mathis et al. (1983). The backside side is illuminated by a standard radiation field (χ = 1). A total visual magnitude of 10 is assumed.
4.2.1. H2 formation
We first check the role of the formation process in the atomic to molecular transition properties. Tables 4–7 display results for four different pressures and three radiation field enhancement factors.
Emissivities in erg cm-2 s-1 sr-1.
The range of dust temperatures at the edge of the clouds has a dramatic effect on the formation rate of H2, when only diffusion mechanisms are involved (B models), as expected. In this latter case, there is not even a range of visual magnitudes where the local density of H2 exceeds that of atomic H, when the pressure is 106 cm-3 K or lower (shown as an ellipsis in the corresponding cells in Tables 4 and 5). The different trends can be understood from analytic developments obtained in a single grain size approximation, as given in Appendices B and C. The effect of pressure is best seen with the χ = 103 results:
-
Grains are warm (from 26 K to 44 K), so that thermal evaporation ofphysisorbed hydrogen is efficient. Therefore, the ER processdominates over the LH one.
-
All things equal, increasing the pressure in case B (where only LH is active) gives results in accordance with Eq. (B.8). The temperature at the edge does not vary much, so that [H] ∝ P and RH2 is indeed proportional to [H] as expected.
-
Including the ER process, RH2 first increases with increasing P owing to a (at first) slow rise in temperature. For the highest pressure, the heating mechanism described in Sect. 3.4 is fully operational, and RH2 decreases as the temperature stabilizes on the right side of the formation rate curve of Fig. C.1.
Increasing χ leads to similar results, with still higher grain temperatures. However, complex UV pumping processes have an increasing role and Eq. (B.8) is less accurate. For a lower radiation field, the range of H densities spanned by increasing pressure is within the critical densities defined in B and the full Eq. (B.7) applies. In both cases, the ER rate closely follows the temperature behavior with a positive feedback being most efficient at high pressure.
We see that allowing for the possibility of chemisorption compensates, in a natural way, the deficiencies of the LH mechanism when dust grains become too warm. The values of the formation rate of molecular hydrogen attained in such bright PDR conditions then become very comparable to the values deduced from the observations (Habart et al. 2004) with an increase by a factor of two to five in the standard 3 × 10-17 nH n(H) cm3 s-1 value depending on the impinging incident radiation field. Even if the chemisorption properties are somewhat empirical (the dependence is discussed in Appendix C), we feel that such a mechanism allows us to solve a major difficulty in the theory of H2 formation.
4.2.2. Emission lines
We now investigate the implications of the new formation scenario on the various emissivities. We display in Tables 8 and 9 the emissivities derived from the previous models. We focus on transitions emitted in the PDR region where photo-chemical and -physical effects are taking place. In line with the results already displayed, we find that the fine-structure emission lines are not very dependent on the formation model of H2 except in a few cases, where temperatures become of the order of thousands K, owing to the enhanced heating mechanisms described in Sect. 3.4. The molecular hydrogen emission transitions are much more sensitive. We display the emissivities of the pure rotational lines detected routinely by Spitzer, as well as the 1–0 S(1) transition at 2.12 μm detected from the ground. Ratios of these emissivities with respect to those of other vibrational lines detected in the K band are given to compare with past (Burton et al. 2002) and future observations. We have also run 190 type C models with different pressures (105 − 108 cm-3 K) and intensity scaling factors of the incident radiation field (1 to 106 Mathis ISRF) on the observer side to display the corresponding contours in different figures. The back-side radiation field is set to χ = 1 and the total visual magnitude,  in order to neglect radiative effects from the back-side. The other model parameters are given in Table 2 and the dust properties correspond to the standard values displayed in Table 1. We display results when both LH and ER mechanisms are activated for the formation of H2 (C type). Figures 2 to 6 display H2, C + , and O line intensities contours in erg cm-2 s-1 sr-1 for a face-on geometry.
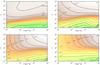 |
Fig. 2 Intensity of H2 lines in erg cm-2 s-1 sr-1 seen in a face-on geometry, for model C, a) 0–0 S(0), b) 0–0 S(1), c) 0–0 S(2), and d) 0–0 S(3). |
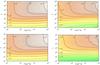 |
Fig. 3 Intensity of H2 lines in erg cm-2 s-1 sr-1 seen in a face-on geometry, for model C, a) 1–0 S(0), b) 1–0 S(1), c) 1–0 S(2), and d) 1–0 S(3). |
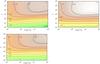 |
Fig. 4 Intensity of H2 lines in erg cm-2 s-1 sr-1 seen in a face-on geometry, for model C, a) 2–1 S(1), b) 2–1 S(2), and c) 2–1 S(3). |
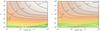 |
Fig. 5 Intensity of O at 63 and 145 μm in erg cm-2 s-1 sr-1 seen in a face-on geometry, for model C. |
Intensity maps for other line intensities and other observation angles can be found on our VO-Theory database, PDR Database (PDRDB), under the project “H2 formation LH+ER – 2011”3. The complete set of output data of the models (giving access to abundances profiles, temperature profile, and formation and destruction rates, ...), input parameters, and source code used to produce these models are also available through PDRDB.
Emissivities of H2 transitions in erg cm-2 s-1 sr-1.
Figures 2–4 show that the intensities (excepted for the 0–0 S(0) line) depend mostly on P for high values of χ/P and on χ for low values of χ/P. Habart et al. (2004) explained this behavior in the case of isochoric models. At the position of the H/H2 transition, and for high χ/nH, photons are mostly absorbed by grains, whereas for low χ/nH they are absorbed in H2 lines (self-shielding). It can be shown that in the first case, the H2 line intensities are proportional to the H2 formation rate and so to nH, whereas, in the second case, they are proportional to the intensity of the incident radiation field. In the case of isobaric models, an analytical derivation is less obvious, but, as we can see in the intensity maps, this trend is valid over three orders of magnitudes of P. In this P range, T varies only by a factor smaller than 10 (Tables 4 to 7). Thus, the variation in P is essentially dominated by the variation in nH, and the same argument applies.
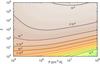 |
Fig. 6 Intensity of C + at 157.63 μm in erg cm-2 s-1 sr-1 seen in a face-on geometry, for model C. |
The orders of magnitude of the H2 line intensities are in good agreement with those of the observations by Spitzer presented in Habart et al. (2011). For example, comparisons of our intensity maps to observations towards the Horsehead for H2 lines (Habart et al. 2011) and O at 63 μm (Goicoechea et al. 2009) gives χ of a few hundreds in Mathis units, which is consistent with previous models. The gas pressure is more difficult to constrain in this way since, for moderate χ, the intensities of those lines depend weakly on P. Of all H2 lines, the 0–0 S(3) line is the more difficult to reproduce. We also note that the intensity of the 1–0 S(1) line, as well as the ratios of vibrational transitions displayed in Table 9 as potential tests of formation pumping, are within the values reported for R1 and R2 towards M17 by Burton et al. (2002) for a pressure of 106 cm-3 K and radiation field enhancement factor of 104. However, the corresponding modeled R3 ratio is significantly smaller. The models in this paper were developed using typical properties of the interstellar medium (such as grain properties) that may not be applicable to a detailed interpretation of the observations towards specific line of sights. As an example, the star illuminating the Horsehead is a O 9.5 type star with an effective temperature of 33 000 K. Scaling a Mathis ISRF as done here does not spread the UV energy in the same way as in a stellar spectrum, which can affect level excitation. We note that most of the PDR observations presented in Habart et al. (2011) are seen edge on, whereas with our plane-parallel model we provide in this paper line intensities for PDRs seen face on and in PDRDBs of up to 60 degrees. Applications to specific lines of sight will be subsequently performed by including all possible constraints derived from the observations.
5. Conclusions
We have presented implementations of the Langmuir-Hinshelwood and Eley-Rideal mechanisms to describe H2 formation on grain surfaces within the Meudon PDR code. This is the first of a series of intended studies to investigate the formation of other molecules on grains the light of recent experimental and theoretical progresses. The Eley-Rideal mechanism involving chemisorbed sites is an efficient process for forming H2 in regions where the gas is hot and dust grains are warm. In previous versions of the code, the Langmuir-Hinshelwood mechanism alone had allowed us to recover the value of the mean formation rate of H2 derived from VUV observations of diffuse and translucent clouds. However, it led to significantly lower values of H2 formation rates in denser and strongly illuminated clouds due to the increasing importance of H evaporation relative to diffusion on the surface of the dust grains. Observations of these high excitation PDRs by, e.g., Habart et al. (2011) and references therein inferred mean formation rates typically a factor of two to five higher (with large uncertainties). This is now recovered by our treatment of the Eley-Rideal process, whose efficiency rises with increasing gas temperature (up to a threshold). Thus, considering that observed rates are mean values along the line of sight and across a large variety of physical conditions, regardless of whether our theoretical rates are local values computed from micro-physics considerations alone, the agreement between model and observations is now also quite satisfactory in high excitation regions.
The Eley-Rideal mechanism also provides an efficient means of heating the gas. Following the Sizun et al. (2010) prescription for spreading the energy released by the formation of a H2 molecule in terms of kinetic energy and internal energy, we have shown that this formation process can be the major heating mechanism under some specific conditions. In particular, in regions where H2 self-shielding is not yet fully efficient and at densities above the critical density of collisions with H, a significant amount of energy can be transferred into the kinetic energy of the gas. The signatures of formation pumping are not straightforward in the light of present knowledge about the internal state of newly formed H2.
The efficiency of the Langmuir-Hinshelwood process depends on the temperature of the grains. As shown by many authors, this formation mechanism can only take place in a small window of grain temperatures (Biham & Lipshtat 2002; Biham et al. 2005; Le Petit et al. 2009), namely 10–20 K for amorphous carbons. As a consequence, the LH mechanism becomes the major H2 formation process at moderate visual extinctions. The strong dependence of the rate on Tgr implies that a proper computing of grain temperature has to be done in numerical models, including the temperature fluctuations of the smallest grains.
We have compared the results of PDR models in which H2 formation is treated by these detailed mechanisms to models using a constant formation rate with RH2 = 3 × 10-17 cm3 s-1. For diffuse clouds parameters, the main effect is to shift the H/H2 transition and to increase the molecular fraction. For stronger PDRs, we have shown that for strong radiation fields, the line intensities depend strongly on gas pressure. The difference between the detailed treatment of H2 formation and a constant formation rate can lead to differences of up to a factor of three in the most commonly observed H2 line intensities. We provided maps of these line intensities for a set of 190 models for different pressures and incident radiation field intensities.
Online material
Appendix A: Other recent updates to the PDR code
Progress have been achieved in computing fine structure and rotational excitation due to collisions with H and/or H2 as reported in the BASECOL (Dubernet et al. 2006) and LAMDA (Schöier et al. 2005) databases. We have updated and/or implemented the collisional excitation rates that play an active role in the cooling processes and computed explicitly their emission spectrum by solving the statistical equilibrium equations, including radiative pumping by the cosmic background radiation field and dust infrared emission (Gonzalez Garcia et al. 2008). We point out that the new fine-structure excitation collision rates of atomic oxygen computed by Abrahamsson et al. (2007) have a significant impact on the temperature at the edge of PDRs. As an example, for a typical proton density of 104 cm-3 and a radiation scaling factor of 10, the temperature at the edge is 90 K with the old Launay & Roueff (1977) atomic oxygen collision rates and only 67 K with the values displayed in Abrahamsson et al. (2007). At the present stage, the emission spectra of millimeter and submillimeter transitions of HCN, OH, CH + , and O2 are readily computed and the implementation of other molecules is straightforward and depends only on the availability of the collision rates by the relevant perturbers. Another significant issue is the inclusion of the thermal and charge balance of the grains in the overall ionization fraction. The thermal balance is obtained through a coupling with the DustEM program Compiègne et al. (2011), which can be switched on through the F_Dustem parameter (F_Dustem=1). If not (F_Dustem=0), the temperature of the various grain bin sizes is obtained from the formula given in Eq. (5) of Hollenbach et al. (1991), where the actual value of the radiation field is introduced. The determination of the grain charge is obtained from the balance between photoelectric effect and recombination on dust particles, expanding on the treatment of Draine & Sutin (1987) and Bakes & Tielens (1994).
The code also computes the photodissociation rates from the integration of the photodissociation cross-sections, when available, with the interstellar radiation field. The attenuation by dust particles is then directly obtained from the dust properties considered in the model, i.e. their absorption and extinction coefficients, which depend on the size and the nature of the dust particles. Different options are proposed depending on the treatment of the grain temperatures. If F_Dustem=1, we use the absorption and scattering coefficients computed by the DustEM code (Compiègne et al. 2011). If F_Dustem=0, we derive the albedo and dust properties from the extinction curve given by the Fitzpatrick and Massa analytic expansion (Fitzpatrick & Massa 2007), extended towards longer wavelengths by the data from Weingartner & Draine (2001)4. It is remarkable that we recover the dust-free photodissociation rates displayed in van Dishoeck (1988) for the Mathis or Draine incident radiation field. The AV dependence of the photodissociation rates then directly reflects the appropriate dust environment.
Appendix B: Langmuir-Hinshelwood mechanism
Upon landing on a grain, most heavy species may build an ice mantle. In this case, it is possible to account for the total number of physisorbed molecules by integrating over the grain size distribution. This is the subject of a forthcoming paper on surface chemistry (Le Petit et al., in prep.). However, this is most probably not the case for the lightest species (H, H2, D, HD, ...). We assume here that they only build a single monolayer above either the grain surface or the ice mantle.
In that case, two effects must be taken into account:
-
upon landing on a site already occupied by a light species, theimpinging species is rejected to the gas phase;
-
binding depends on the (size-dependent) temperature of the grain and thus the steady state depends on the size (and characteristics) of the grain.
Hence, we must compute the number of physisorbed particles of type X on a grain of size a. This is NX:(a) in the following (in particles per grain, and not in particles per cubic centimeter). The total amount of X on all grains, that follows by integration, is ![Mathematical equation: \appendix \setcounter{section}{2} \begin{eqnarray*} [X:]=\int_{a_{\rm min}}^{a_{\rm max}}\, N_{\mathrm{X:}}(a)\, {\rm d}n_{\rm g}=A_{\rm gr}\, n_{\mathrm{H}}\,\int_{a_{\rm min}}^{a_{\rm max}}\, N_{\mathrm{X:}}(a)\, a^{-\alpha}\, {\rm d}a, \end{eqnarray*}](/articles/aa/full_html/2012/05/aa18126-11/aa18126-11-eq309.png) where the last expression is for a MRN size distribution with dng = Agr nH a − α da. Agr is a normalization factor, nH is the gas density (in cm-3), and a the grain radius (in cm). In the following, we use that case as an example, but it is easy to generalize to any distribution. Numerical integration is performed by discretizing the size. When needed, we use
where the last expression is for a MRN size distribution with dng = Agr nH a − α da. Agr is a normalization factor, nH is the gas density (in cm-3), and a the grain radius (in cm). In the following, we use that case as an example, but it is easy to generalize to any distribution. Numerical integration is performed by discretizing the size. When needed, we use 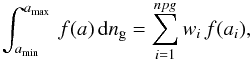 where the weights wi and abscissae ai are chosen according to the distribution. The number of abscissae is npg. Table B.1 displays the abscissae and weights computed for the parameters of the MRN distribution given in Table 1. These coefficients must be computed anew whenever one changes the range of sizes5. Here
 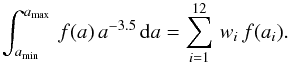 Remark that the power a-3.5 does not appear in the discrete sum.
Abscissae and weights for the Gaussian integration of a MRN size distribution with npg = 12, α = 3.5, amin = 3 × 10⁻⁷ cm, and amax = 3 × 10⁻⁵ cm.
Three types of reactions must be considered:
-
Adsorption;
-
Ejection;
-
Reaction.
We do not consider reactions with heavy atoms nor molecules (including ices) which will be the subject of a follow-up paper.
B.1. Adsorption
If the outer layer of the grain is populated by light species (H, H2), then any one of them may lead to the rejection of an impinging atom. We consider nj of these species. The number of accretion events of a species X per unit time interval on a single grain of size a is then ![Mathematical equation: \appendix \setcounter{section}{2} \begin{eqnarray*} s(\mathrm{X})\,[\mathrm{X}]\,\bar{v}(\mathrm{X})\,\pi\, a^{2}\,\left(1-\frac{d_{\rm s}^{2}}{4\pi\, a^{2}}\,\sum_{j}^{n_{j}}N_{\mathrm{Y_{j}:}}(a)\right), \end{eqnarray*}](/articles/aa/full_html/2012/05/aa18126-11/aa18126-11-eq326.png) where s(X) is the sticking coefficient of species X, ds the mean distance between adsorption sites (assumed to be identical for all grains), and the term in parentheses takes into account rejection by any species Yj that is already on the grain. The term
where s(X) is the sticking coefficient of species X, ds the mean distance between adsorption sites (assumed to be identical for all grains), and the term in parentheses takes into account rejection by any species Yj that is already on the grain. The term  is the total number of adsorption sites on a grain of size a. Formally, this equation may be divided into a first-order formation reaction of rate
  , and nj different second-order destruction reactions of rate
  . The relevant creation and destruction equations are thus
 ![Mathematical equation: \appendix \setcounter{section}{2} \begin{equation} \frac{{\rm d}N_{\mathrm{X:}}(a)}{{\rm d}t}=k_{\rm ad}(a)\,[\mathrm{X}]-\sum_{j}\, k_{\rm rej}\,[\mathrm{X}]\, N_{\mathrm{Y_{j}:}}(a)\label{eq_surf_ads} \end{equation}](/articles/aa/full_html/2012/05/aa18126-11/aa18126-11-eq332.png) (B.1)
(B.1)![Mathematical equation: \appendix \setcounter{section}{2} \begin{eqnarray*} -\frac{{\rm d}[\mathrm{X}]}{{\rm d}t}=\left(\int_{a_{\rm min}}^{a_{\rm max}}\, k_{\rm ad}\, {\rm d}n_{\rm g}\right)\,[\mathrm{X}]-\sum_{j}\,\int_{a_{\rm min}}^{a_{\rm max}}\, k_{\rm rej}\, N_{\mathrm{Y_{j}:}}(a)\, {\rm d}n_{\rm g}\,[\mathrm{X}] \end{eqnarray*}](/articles/aa/full_html/2012/05/aa18126-11/aa18126-11-eq333.png) or
or ![Mathematical equation: \appendix \setcounter{section}{2} \begin{equation} -\frac{{\rm d}[\mathrm{X}]}{{\rm d}t}=k_{\rm rej}\,\frac{S_{\rm gr}}{d_{\rm s}^{2}}\,[\mathrm{X}]-k_{\rm rej}\,\sum_{j}^{n_{j}}\,\sum_{i}^{npg}\, w_{i}\, N_{\mathrm{Y_{j}:}}(a_{i})\,[\mathrm{X}]\label{eq_adsor} \end{equation}](/articles/aa/full_html/2012/05/aa18126-11/aa18126-11-eq334.png) (B.2)where Sgr is the total surface of grains per unit volume. One can see that, although the form of the reaction terms is preserved (first or second order polynomials in the variables) the total number of individual contributions becomes large (one accretion leads to (nj × npg + 1) reactions)6.
(B.2)where Sgr is the total surface of grains per unit volume. One can see that, although the form of the reaction terms is preserved (first or second order polynomials in the variables) the total number of individual contributions becomes large (one accretion leads to (nj × npg + 1) reactions)6.
B.2. Desorption processes
Ejection can occur spontaneously (thermal evaporation) or by either photo-desorption or cosmic-ray ejection. All processes are similar in the sense that they only involve a single variable NX(a) for a grain of size a.
If the vibration frequency of the adsorbed particle is ν0, the temperature of the grain is Tgr(a), and the binding energy is Tb(X), then the number of evaporation per unit time is  If the flux of photons (respectively cosmic rays) is Fph (respectively FCR) and the number of particles desorbed by impact is ηph (respectively ηCR), then the number of desorption is (for a photon)
 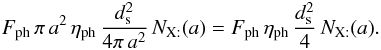 Writing
 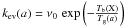 ,
,  and
and  , we have
 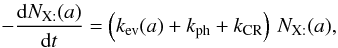 (B.3)
(B.3)![Mathematical equation: \appendix \setcounter{section}{2} \begin{equation} \frac{{\rm d}[\mathrm{X}]}{{\rm d}t}=\sum_{i}^{npg}\, k_{\rm ev}(a_{i})\, w_{i}\, N_{\mathrm{X:}}(a_{i})+\left(k_{\rm ph}+k_{\rm CR}\right)\,\sum_{i}^{npg}\, w_{i}\, N_{\mathrm{X:}}(a_{i}).\label{eq_eject} \end{equation}](/articles/aa/full_html/2012/05/aa18126-11/aa18126-11-eq349.png) (B.4)
(B.4)
B.3. Surface reactions
We seek to compute the number of encounters per grain and per unit time. We adopt first the point of view of X:. On a single grain of size a, the number of encounter per s is proportional to 1/tX the inverse hoping time of X:, the probability of finding a Y: upon landing and the number of X: 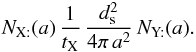 During the same time, from the point of view of Y:, the number of encounters made is
 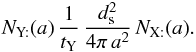 So the total number of encounters is
  where the factor of
  takes care of each encounter having been counted twice. Thus, for two surface species, we can write
  , and
, and 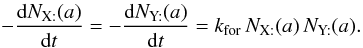 (B.5)The production rate of Z in the gas phase, occurring directly after the encounter of two adsorbed atoms, is obtained after integration on the grain size distribution
 ![Mathematical equation: \appendix \setcounter{section}{2} \begin{equation} \frac{{\rm d}[\mathrm{Z}]}{{\rm d}t}=\frac{d_{\rm s}^{2}}{8\pi}\,\sum_{i}^{npg}\left(\frac{1}{t_{\mathrm{X}}(a_{i})}+\frac{1}{t_{\mathrm{Y}}(a_{i})}\right)\,\frac{w_{i}}{a_{i}^{2}}\, N_{\mathrm{X:}}(a_{i})\, N_{\mathrm{Y:}}(a_{i}).\label{eq_formLH} \end{equation}](/articles/aa/full_html/2012/05/aa18126-11/aa18126-11-eq362.png) (B.6)
(B.6)
B.4. Approximate H2 formation rate
For a single grain size, and negligible photodesorption and cosmic-ray desorption, we can derive an analytic approximation to the H2 formation rate in the spirit of the discussion of Biham & Lipshtat (2002). If H is the only atom sticking to a grain of size a with a sticking probability of 1, then ![Mathematical equation: \appendix \setcounter{section}{2} \begin{eqnarray*} \frac{{\rm d}N_{\mathrm{H:}}}{{\rm d}t}=k_{\rm ad}\,[\mathrm{H}]-\, k_{\rm rej}\,[\mathrm{H}]\, N_{\mathrm{H:}}-k_{\rm ev}\, N_{\mathrm{H:}}-2\, k_{\rm for}\, N_{\mathrm{H:}}^{2}. \end{eqnarray*}](/articles/aa/full_html/2012/05/aa18126-11/aa18126-11-eq363.png) In a steady state, this leads to
In a steady state, this leads to ![Mathematical equation: \appendix \setcounter{section}{2} \begin{eqnarray} N_{\mathrm{H:}}&=&\frac{[\mathrm{H}]}{[\mathrm{H}]_{b}}\,\left(1+\frac{[\mathrm{H}]_{a}}{[\mathrm{H}]}\right)\nonumber \\ &&\times \left[-1+\sqrt{1+2\, N_{\mathrm{H:}}^{\rm max}\,\frac{[\mathrm{H}]_{\rm b}}{[\mathrm{H}]}\,\frac{1}{\left(1+\frac{[\mathrm{H}]_{a}}{[\mathrm{H}]}\right)^{2}}}\right],\label{eq:LH_full} \end{eqnarray}](/articles/aa/full_html/2012/05/aa18126-11/aa18126-11-eq364.png) (B.7)where
(B.7)where  is the maximum number of H on the grain, and the two critical densities [H] a and[H] b are defined as
 ![Mathematical equation: \appendix \setcounter{section}{2} \begin{eqnarray*} [\mathrm{H}]_{a}=\frac{k_{\rm ev}}{k_{\rm rej}}=\frac{4\,\nu_{0}}{\bar{v}\, d_{\rm s}^{2}}\,\exp\left(-\frac{T_{b}}{T_{\rm g}}\right), \end{eqnarray*}](/articles/aa/full_html/2012/05/aa18126-11/aa18126-11-eq368.png)
![Mathematical equation: \appendix \setcounter{section}{2} \begin{eqnarray} [\mathrm{H}]_{b}=\frac{4\, k_{\rm for}}{k_{\rm rej}}&=&\frac{4\,\nu_{0}}{\overline{v}(\mathrm{H)}\, d_{\rm s}^{2}}\,\frac{4}{N_{\mathrm{H:}}^{\rm max}} \exp\left(-\frac{T_{\rm d}}{T_{\rm g}}\right)\,\nonumber\\ &=&\frac{4\,\nu_{0}}{\pi\,\overline{v}(\mathrm{H)\, {\it a}^{2}}}\, {\exp\left(-\frac{T_{\rm d}}{T_{\rm g}}\right)}\cdot\nonumber \end{eqnarray}](/articles/aa/full_html/2012/05/aa18126-11/aa18126-11-eq369.png) Table B.2 gives the values of the critical densities for different grain temperatures.
Table B.2 gives the values of the critical densities for different grain temperatures.
Critical densities in the LH formation rate of H2 for amorphous carbon and a mean distance between physisorbed sites of 2.6 Å , where T is the gas temperature in K.
The H2 formation rate per grain is then (with ng the number of grains per cubic centimeter of gas =  )
) ![Mathematical equation: \appendix \setcounter{section}{2} \begin{eqnarray*} \frac{1}{n_{\rm g}}\,\left.\frac{{\rm d}[\mathrm{H}_{2}]}{{\rm d}t}\right|_{\rm LH}=k_{\rm for}\, N_{\mathrm{H:}}^{2} \end{eqnarray*}](/articles/aa/full_html/2012/05/aa18126-11/aa18126-11-eq388.png) and can be given analytically from the previous formulae. Both [H] a and[H] b vary slowly with the gas temperature, but very strongly with the grain temperature. Thus, we can define two limiting regimes for the gas phase atomic hydrogen density, namely
and can be given analytically from the previous formulae. Both [H] a and[H] b vary slowly with the gas temperature, but very strongly with the grain temperature. Thus, we can define two limiting regimes for the gas phase atomic hydrogen density, namely
-
Case 1: [H] ≫ [H] a > [H] b. Then
![Mathematical equation: \appendix \setcounter{section}{2} \begin{eqnarray*} \frac{1}{n_{\rm g}}\,\left.\frac{{\rm d}[\mathrm{H}_{2}]}{{\rm d}t}\right|_{\rm LH}=\nu_{0}\,\frac{4\pi\, a^{2}}{d_{\rm s}^{2}}\,\exp\left(-\frac{T_{\rm d}}{T_{\rm g}}\right), \end{eqnarray*}](/articles/aa/full_html/2012/05/aa18126-11/aa18126-11-eq392.png)
![Mathematical equation: \appendix \setcounter{section}{2} \begin{eqnarray*} \frac{{\rm d}[\mathrm{H_{2}]}}{{\rm d}t}\,=\,\nu_{0}\,\frac{1}{d_{\rm s}^{2}}\,\times\,\frac{3\times1.4\, m_{\mathrm{H}}\, G}{\rho a}\,\times\, \exp\left(-\frac{T_{\rm d}}{T_{\rm g}}\right)\,\times\, n_{\mathrm{H}}\cdot \end{eqnarray*}](/articles/aa/full_html/2012/05/aa18126-11/aa18126-11-eq393.png) This is possible only for cold grains (typically below 15 K). Hence, it requires both a high density (or pressure) and a weak radiation field.
This is possible only for cold grains (typically below 15 K). Hence, it requires both a high density (or pressure) and a weak radiation field.
-
Case 2: [H] ≪ [H] b < [H] a. Then
![Mathematical equation: \appendix \setcounter{section}{2} \begin{eqnarray*} N_{\mathrm{H:}}=\frac{N_{\mathrm{H:}}^{\rm max}}{[\mathrm{H}]_{a}}\,[\mathrm{H}]=\frac{\pi\, a^{2}\,\bar{v}}{\nu_{0}}\,\exp\left(\frac{T_{\rm b}}{T_{\rm g}}\right)\,[\mathrm{H}] , \end{eqnarray*}](/articles/aa/full_html/2012/05/aa18126-11/aa18126-11-eq396.png)
![Mathematical equation: \appendix \setcounter{section}{2} \begin{equation} \frac{1}{n_{\rm g}}\,\left.\frac{{\rm d}[\mathrm{H}_{2}]}{{\rm d}t}\right|_{\rm LH}=\pi\, a^{2}\,\bar{v}\,\frac{d_{\rm s}^{2}\,\bar{v}}{4\,\nu_{0}}\,\exp\left(\frac{2\, T_{\rm b}-T_{\rm d}}{T_{\rm g}}\right)\,[\mathrm{H}]^{2} ,\label{eq:LH_lowH} \end{equation}](/articles/aa/full_html/2012/05/aa18126-11/aa18126-11-eq397.png) (B.8)
(B.8)
![Mathematical equation: \appendix \setcounter{section}{2} \begin{eqnarray*} \left.\frac{{\rm d}[\mathrm{H}_{2}]}{{\rm d}t}\right|_{\rm LH}=\bar{v}(\mathrm{H)^{2}}\,\frac{d_{\rm s}^{2}}{4\,\nu_{0}}\,\frac{3\times1.4\, m_{\mathrm{H}}\, G}{\pi\,\rho\, a}\,\exp\left(\frac{2\, T_{\rm b}-T_{\rm d}}{T_{\rm g}}\right)\, n_{\mathrm{H}}\,[\mathrm{H}]^{2}. \end{eqnarray*}](/articles/aa/full_html/2012/05/aa18126-11/aa18126-11-eq398.png) This is the case for all grain sizes as soon as Tg is higher than about 25 K. Hence, it applies to all strong radiation field models. In that case, the formation rate increases as the square of the density of H.
This is the case for all grain sizes as soon as Tg is higher than about 25 K. Hence, it applies to all strong radiation field models. In that case, the formation rate increases as the square of the density of H.
The usual expression for the formation rate RH2 in cm3 s-1 follows from ![Mathematical equation: \appendix \setcounter{section}{2} \begin{eqnarray*} \left.\frac{{\rm d}[\mathrm{H}_{2}]}{{\rm d}t}\right|_{\rm LH}=R_{\mathrm{H}_{2}}\, n_{\mathrm{H}}\,[\mathrm{H}]. \end{eqnarray*}](/articles/aa/full_html/2012/05/aa18126-11/aa18126-11-eq401.png) Since ng is proportional to nH, we see that in the first case RH2 ∝ 1/[H] , whereas in the second RH2 ∝ [H] . These relations apply only for the approximations made here.
Since ng is proportional to nH, we see that in the first case RH2 ∝ 1/[H] , whereas in the second RH2 ∝ [H] . These relations apply only for the approximations made here.
Appendix C: Eley-Rideal mechanism
C.1. Formalism
We consider the impact of a fast atom (hot gas) on a grain. Since a fully detailed description (taking into account all possible kinds of surfaces) is far beyond the capabilities of our model, we search for an approximate mechanism that takes into account the following requirements:
-
it is efficient in “hot” gas and on “hot” grains, hence the impinging Hatom must eventually reach a chemisorbed site on the grain;
-
it leads to H2 formation rates that are consistent with observational constraints;
-
the number of free parameters remains at the lowest possible number.
Since this process takes place at the edge of the cloud, we assume that the grains are essentially bare (without ice coating) and that the process does not depend on the grain temperature. This approximation is justified since, at the edge of PDRs, grain temperatures (at most 100 K) are much lower than either the gas temperature or chemical binding energies on grain surfaces.
On impact, the gas phase H can find either a free chemisorpsion site or an already chemisorbed H. In the second case, since the formation of H2 releases 4.5 eV, an energy far higher than the chemisorbed well, we assume that a newly formed H2 is immediately released in the gas phase. Hence ![Mathematical equation: \appendix \setcounter{section}{3} \begin{eqnarray*} \left.\frac{{\rm d}[\mathrm{H}_{2}]}{{\rm d}t}\right|_{\rm ER}=-\left.\frac{{\rm d}[\mathrm{H::}]}{{\rm d}t}\right|_{\rm dest}=v_{\rm th}\,\langle n\sigma_{\rm gr}\rangle\,[\mathrm{H}]\,\frac{[\mathrm{H::}]}{[\mathrm{H::}]_{\rm max}}, \end{eqnarray*}](/articles/aa/full_html/2012/05/aa18126-11/aa18126-11-eq405.png) where [H::] max is the maximum number of chemisorbed H atoms (saturated grains) and [H::] the corresponding abundance. In addition vth is the thermal velocity of the gas phase H and we consider the geometrical cross-section to compute the total amount of grain surface per unit volume ⟨ nσgr ⟩ . If the mean distance between chemisorption sites is ds and is the same on all types of grains, one can see (from purely geometric considerations) that
where [H::] max is the maximum number of chemisorbed H atoms (saturated grains) and [H::] the corresponding abundance. In addition vth is the thermal velocity of the gas phase H and we consider the geometrical cross-section to compute the total amount of grain surface per unit volume ⟨ nσgr ⟩ . If the mean distance between chemisorption sites is ds and is the same on all types of grains, one can see (from purely geometric considerations) that ![Mathematical equation: \appendix \setcounter{section}{3} \begin{eqnarray*} \frac{\langle n\sigma_{\rm gr}\rangle}{[\mathrm{H::}]_{\rm max}}=\frac{d_{\rm s}^{2}}{4}\cdot \end{eqnarray*}](/articles/aa/full_html/2012/05/aa18126-11/aa18126-11-eq408.png) This is true for any grain size distribution. If the gas phase atom impacts a free chemisorption site, we have to estimate the probability that it sticks to the grain. The simplest hypothesis requires that it be proportional to the number of collisions of H with grains per unit of time (vth ⟨ nσgr ⟩ ), possibly with a barrier to cross
This is true for any grain size distribution. If the gas phase atom impacts a free chemisorption site, we have to estimate the probability that it sticks to the grain. The simplest hypothesis requires that it be proportional to the number of collisions of H with grains per unit of time (vth ⟨ nσgr ⟩ ), possibly with a barrier to cross  (where T is the gas temperature and T1 the threshold), with a temperature dependent sticking coefficient α(T) and proportional to the “free room”
 ![Mathematical equation: \hbox{$\left(1-\frac{[\mathrm{H::}]}{[\mathrm{H::}]_{\rm max}}\right)$}](/articles/aa/full_html/2012/05/aa18126-11/aa18126-11-eq411.png) . Hence we write
. Hence we write ![Mathematical equation: \appendix \setcounter{section}{3} \begin{eqnarray*} \left.\frac{{\rm d}[\mathrm{H::}]}{{\rm d}t}\right|_{\rm form}=\alpha(T)\, v_{\rm th}\, \langle n\sigma_{\rm gr}\rangle \,[\mathrm{H}]\,\exp\left(-\frac{T_{1}}{T}\right)\,\left(1-\frac{[\mathrm{H::}]}{[\mathrm{H::}]_{\rm max}}\right)\cdot \end{eqnarray*}](/articles/aa/full_html/2012/05/aa18126-11/aa18126-11-eq412.png) This equation is split in the code into two: a direct formation reaction and a “pseudo” rejection reaction. The corresponding rates are
This equation is split in the code into two: a direct formation reaction and a “pseudo” rejection reaction. The corresponding rates are ![Mathematical equation: \appendix \setcounter{section}{3} \begin{eqnarray*} \left.\frac{{\rm d}[\mathrm{H::}]}{{\rm d}t}\right|_{\rm form,d}=\alpha(T)\, v_{\rm th}\, \langle n\sigma_{\rm gr}\rangle\,\exp\left(-\frac{T_{1}}{T}\right)\,[\mathrm{H}], \end{eqnarray*}](/articles/aa/full_html/2012/05/aa18126-11/aa18126-11-eq413.png)
![Mathematical equation: \appendix \setcounter{section}{3} \begin{eqnarray*} \left.\frac{{\rm d}[\mathrm{H::}]}{{\rm d}t}\right|_{\rm form,r}=-\alpha(T)\, v_{\rm th}\,\frac{d_{\rm s}^{2}}{4}\,\exp\left(-\frac{T_{1}}{T}\right)\,[\mathrm{H}]\,[\mathrm{H::}]. \end{eqnarray*}](/articles/aa/full_html/2012/05/aa18126-11/aa18126-11-eq414.png)
C.2. Sticking coefficient and choice of T1
There is not much information on how to define the sticking function α(T), but we expect that it goes to 0 for very high temperatures (the atom just bounces on the grain without there being any time to evacuate the excess kinetic energy). We introduce the empirical form  (C.1)In this expression, the index β controls the steepness of the decrease in α(T), and T2 defines the temperature such that
  .
.
We may constrain the value of β with the following considerations:
-
an estimate of the velocity v2 above which theatom bounces back to the gas is given by

-
the sticking coefficient is approximated as the fraction of gas phase atom with velocity lower than v2. Using a Maxwell distribution at temperature T, we have
 . Defining T2 by
  , we get
 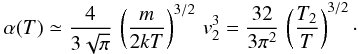 This shows that
  in Eq. (C.1) is exact. The prefactor is 1.08, which we can take as 1 given the approximations involved; thus Eq. (C.1) is a good approximation over the whole temperature range. The estimate of v2 gives T2 in the range 400 − 500 K7.
Given α(T), we may investigate which barrier T1 gives a “standard” formation rate of 3 × 10-17 cm3 s-1 at a given temperature T. We find that 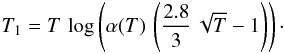 Postulating that where grains are warm, the gas is warm too, we may require that this standard rate is reached for a temperature in the range [150:450] K. This translate into a range [100:800] K for T1. Our choice of T1 = 300 K favors an efficient formation, and reflects the idea that chemisorption is easy (but not instantaneous) on grains with plenty of surface defects. This leads to a higher formation rate at high gas temperature as found observationally by Habart et al. (2004).
C.3. Analytical approximation
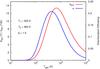 |
Fig. C.1 Left axis: variation of kER with gas temperature T (relative to the one at 100 K). Right axis: chemisorption efficiency κ (see text). |
If hydrogen is the only chemisorbed species, the abundance of H:: can be analytically derived at a steady state ![Mathematical equation: \appendix \setcounter{section}{3} \begin{eqnarray*} [\mathrm{H::}]=\frac{\alpha(T)\,\exp\left(-\frac{T_{1}}{T}\right)}{1+\alpha(T)\,\exp\left(-\frac{T_{1}}{T}\right)}\,[\mathrm{H::}]_{\rm max}, \end{eqnarray*}](/articles/aa/full_html/2012/05/aa18126-11/aa18126-11-eq438.png) which leads to an H2 formation rate of
which leads to an H2 formation rate of ![Mathematical equation: \appendix \setcounter{section}{3} \begin{equation} \left.\frac{{\rm d}[\mathrm{H}_{2}]}{{\rm d}t}\right|_{\rm ER}=v_{\rm th}\, \langle n\sigma_{\rm gr}\rangle\,\kappa(T\text{)}\,[\mathrm{H}]=k_{\rm ER}\,[\mathrm{H}]\, n_{\mathrm{H}}\label{eq:_ER_rate} \end{equation}](/articles/aa/full_html/2012/05/aa18126-11/aa18126-11-eq439.png) (C.2)with
(C.2)with 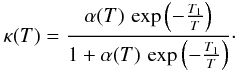 In this expression, vth ⟨ nσgr ⟩ [H] refers to a purely geometric collisional process. Figure C.1 displays the variation in the chemisorption rate as a function of gas temperature (relative to the one at 100 K). The rate is negligible at low temperature owing to the exponential barrier. It grows as the square root of T where the barrier is negligible, then is quenched by the sticking cutoff. The chemisorption efficiency, κ(T), is displayed in Fig. C.1 (right axis). It peaks at a few hundred Kelvin and remains significantly high up to a few thousands of Kelvin.
This behavior is qualitatively very similar to results found by Cuppen et al. (2010, their Fig. 2) from Monte Carlo simulations of H2 formation including both physisorption and chemisorption. They also found that the formation efficiency increases with temperature for gas temperatures around a thousand K.
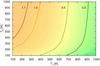 |
Fig. C.2 Effect of the variations in T1 and T2 on the intensity of H2 1–0 S(1) line for the model P = 107 cm-3 K and χ = 1000. Values plotted in the plane T1,T2 are I(T1,T2)/I(300,464). |
In Sect. 4.2.2, we present several line intensities computed from models in which H2 is formed by the ER and LH mechanisms. In these models, we adopted β = 1.5, T1 = 300 K, and T2 = 464 K. Figure C.2 presents the effect of variations in T1 and T2 on the intensity of one line of H2. We note that T1 is the most important parameter and that the line intensity can be reduced by
a factor ≃ 5 if this parameter is increased from 300 K to 1000 K. For other lines, such as 0–0 S(0) this decrease can reach a factor of ten. As mentioned above, for real interstellar grains, we can expect to have a large range of T1 depending on the nature and structure of the grains surfaces. Even if most chemisorbed sites have high thresholds, it only requires a few low thresholds sites for the ER mechanism to be efficient.
Appendix D: AV to size conversion
For constant dust properties along the line of sight, it is possible to convert optical depth in the visible to a distance (in pc) analytically. We define Cd to be the total proton column-density to color index ratio, and RV the usual extinction to color index ratio:  Then, using AV = 2.5 log 10(e) τV, we have
  hence, with
  , we have
  We note that
  , where κV + σV is the extinction (sum of absorption plus scattering) per H atom by grains at the wavelength of the photometric band V.
Hasegawa & Herbst (1993) assumed a 1 Å width between the two physisorbed sites, which is much smaller than the mean distance computed from the density of sites displayed in Table 1.
For instance, for the preferentially populated level v = 5, J = 6, the total radiative decay probability is A6,5 = 3.7 × 10⁻⁶ s-1. Collision deexcitation rates with H at 1000 K are typically a few times 10-12 cm3 s-1 , which gives critical densities close to 106 cm-3.
Available at http://pdr.obspm.fr
Available from http://www.astro.princeton.edu/~draine/dust/dustmix.html
They are computed automatically during the initialization phase of the code.
In the Meudon PDR code, we use a specific Gaussian scheme to integrate over the MRN distribution. This keeps npg to a reasonably low value (typically 12).
The value T2 = 464 K was selected to match a previous “guesstimate” proportional to 10-4 Tβ.
Acknowledgments
This work was partially funded by grant ANR-09-BLAN-0231-01 from the French Agence Nationale de la Recherche as part of the SCHISM project and by the French CNRS national program PCMI. The authors acknowledge computing support in term of resources and services of France Grilles and the EGI e-infrastructure as well as MESOPSL, the computing center for Paris Sciences et Lettres. Some kinetic data have been downloaded from the online KIDA (KInetic Database for Astrochemistry, http://kida.obs.u-bordeaux1.fr) database. We thank our colleagues at the “Laboratoire des Collisions Atomiques et Moléculaires” in Orsay, V. Sidis, N. Rougeaud, and D. Bachellerie for fruitful discussions on the ER process.We thank David Languignon, Nicolas Moreau, Benjamin Ooghe, and Emeric Bron for their help in running some of the models and setting them up on the on-line database.
References
- Abrahamsson, E., Krems, R. V., & Dalgarno, A. 2007, ApJ, 654, 1171 [NASA ADS] [CrossRef] [Google Scholar]
- Bachellerie, D., Sizun, M., Aguillon, F., et al. 2009, Phys. Chem. Chem. Phys. 11, 2715 [Google Scholar]
- Bakes, E. L. O., & Tielens, A. G. G. M. 1994, ApJ, 427, 822 [NASA ADS] [CrossRef] [Google Scholar]
- Biham, O., & Lipshtat, A. 2002, Phys. Rev. E, 66, 056103 [NASA ADS] [CrossRef] [Google Scholar]
- Biham, O., Furman, I., Pirronello, V., & Vidali, G. 2001, ApJ, 553, 595 [NASA ADS] [CrossRef] [Google Scholar]
- Biham, O., Lipshtat, A., & Perets, H. B. 2005, in Astrochemistry: Recent Successes and Current Challenges, ed. D. C. Lis, G. A. Blake, & E. Herbst, IAU Symp., 231, 345 [Google Scholar]
- Black, J. H., & van Dishoeck, E. F. 1987, ApJ, 322, 412 [NASA ADS] [CrossRef] [Google Scholar]
- Burgh, E. B., France, K., & McCandliss, S. R. 2007, ApJ, 658, 446 [NASA ADS] [CrossRef] [Google Scholar]
- Burton, M. G., Londish, D., & Brand, P. W. J. L. 2002, MNRAS, 333, 721 [NASA ADS] [CrossRef] [Google Scholar]
- Cazaux, S., & Tielens, A. G. G. M. 2004, ApJ, 604, 222 [NASA ADS] [CrossRef] [Google Scholar]
- Cazaux, S., & Tielens, A. G. G. M. 2010, ApJ, 715, 698 [NASA ADS] [CrossRef] [Google Scholar]
- Chang, Q., Cuppen, H. M., & Herbst, E. 2006, A&A, 458, 497 [NASA ADS] [CrossRef] [EDP Sciences] [Google Scholar]
- Compiègne, M., Verstraete, L., Jones, A., et al. 2011, A&A, 525, A103 [NASA ADS] [CrossRef] [EDP Sciences] [Google Scholar]
- Congiu, E., Matar, E., Kristensen, L. E., Dulieu, F., & Lemaire, J. L. 2009, MNRAS, 397, L96 [NASA ADS] [CrossRef] [Google Scholar]
- Cuppen, H. M., Morata, O., & Herbst, E. 2006, MNRAS, 367, 1757 [NASA ADS] [CrossRef] [Google Scholar]
- Cuppen, H. M., Kristensen, L. E., & Gavardi, E. 2010, MNRAS, 406, L11 [NASA ADS] [Google Scholar]
- Draine, B. T., & Sutin, B. 1987, ApJ, 320, 803 [NASA ADS] [CrossRef] [Google Scholar]
- Dubernet, M., Grosjean, A., Flower, D., et al. 2006, J. Plasma Res. Ser., 7, 356 [Google Scholar]
- Duley, W. W., & Williams, D. A. 1993, MNRAS, 260, 37 [NASA ADS] [CrossRef] [Google Scholar]
- Farebrother, A. J., Meijer, A. J. H. M., Clary, D. C., & Fisher, A. J. 2000, Chem. Phys. Lett., 319, 303 [NASA ADS] [CrossRef] [Google Scholar]
- Fitzpatrick, E. L., & Massa, D. 1990, ApJS, 72, 163 [NASA ADS] [CrossRef] [Google Scholar]
- Fitzpatrick, E. L., & Massa, D. 2007, ApJ, 663, 320 [NASA ADS] [CrossRef] [EDP Sciences] [Google Scholar]
- Goicoechea, J. R., Compiègne, M., & Habart, E. 2009, ApJ, 699, L165 [NASA ADS] [CrossRef] [Google Scholar]
- Gonzalez Garcia, M., Le Bourlot, J., Le Petit, F., & Roueff, E. 2008, A&A, 485, 127 [NASA ADS] [CrossRef] [EDP Sciences] [Google Scholar]
- Gry, C., Boulanger, F., Nehmé, C., et al. 2002, A&A, 391, 675 [NASA ADS] [CrossRef] [EDP Sciences] [Google Scholar]
- Habart, E., Boulanger, F., Verstraete, L., Walmsley, C. M., & Pineau des Forêts, G. 2004, A&A, 414, 531 [NASA ADS] [CrossRef] [EDP Sciences] [Google Scholar]
- Habart, E., Walmsley, M., Verstraete, L., et al. 2005, Space Sci. Rev., 119, 71 [Google Scholar]
- Habart, E., Abergel, A., Boulanger, F., et al. 2011, A&A, 527, A122 [NASA ADS] [CrossRef] [EDP Sciences] [Google Scholar]
- Hasegawa, T. I., & Herbst, E. 1993, MNRAS, 261, 83 [NASA ADS] [CrossRef] [Google Scholar]
- Hasegawa, T. I., Herbst, E., & Leung, C. M. 1992, ApJS, 82, 167 [NASA ADS] [CrossRef] [Google Scholar]
- Hauser, M. G., Arendt, R. G., Kelsall, T., et al. 1998, ApJ, 508, 25 [NASA ADS] [CrossRef] [Google Scholar]
- Hollenbach, D., & Salpeter, E. E. 1971, ApJ, 163, 155 [NASA ADS] [CrossRef] [Google Scholar]
- Hollenbach, D. J., Takahashi, T., & Tielens, A. G. G. M. 1991, ApJ, 377, 192 [NASA ADS] [CrossRef] [Google Scholar]
- Hollenbach, D., Kaufman, M. J., Bergin, E. A., & Melnick, G. J. 2009, ApJ, 690, 1497 [CrossRef] [Google Scholar]
- Hornekær, L., Baurichter, A., Petrunin, V. V., Field, D., & Luntz, A. C. 2003, Science, 302, 1943 [NASA ADS] [CrossRef] [PubMed] [Google Scholar]
- Islam, F., Latimer, E. R., & Price, S. D. 2007, J. Chem. Phys., 127, 064701 [NASA ADS] [CrossRef] [Google Scholar]
- Islam, F., Cecchi-Pestellini, C., Viti, S., & Casu, S. 2010, ApJ, 725, 1111 [NASA ADS] [CrossRef] [Google Scholar]
- Jenkins, E. B., & Shaya, E. J. 1979, ApJ, 231, 55 [NASA ADS] [CrossRef] [Google Scholar]
- Jenkins, E. B., & Tripp, T. M. 2001, ApJS, 137, 297 [NASA ADS] [CrossRef] [Google Scholar]
- Jenkins, E. B., & Tripp, T. M. 2007, in SINS – Small Ionized and Neutral Structures in the Diffuse Interstellar Medium, ed. M. Haverkorn, & W. M. Goss, ASP Conf. Ser., 365, 51 [Google Scholar]
- Jura, M. 1974, ApJ, 191, 375 [NASA ADS] [CrossRef] [Google Scholar]
- Katz, N., Furman, I., Biham, O., Pirronello, V., & Vidali, G. 1999, ApJ, 522, 305 [NASA ADS] [CrossRef] [Google Scholar]
- Kaufman, M. J., Wolfire, M. G., & Hollenbach, D. J. 2006, ApJ, 644, 283 [NASA ADS] [CrossRef] [Google Scholar]
- Kim, H., Balgar, T., & Hasselbrink, E. 2011, Chem. Phys. Lett., 508, 1 [NASA ADS] [CrossRef] [Google Scholar]
- Latimer, E. R., Islam, F., & Price, S. D. 2008, Chem. Phys. Lett., 455, 174 [NASA ADS] [CrossRef] [Google Scholar]
- Launay, J. M., & Roueff, E. 1977, A&A, 56, 289 [NASA ADS] [Google Scholar]
- Le Bourlot, J., Pineau des Forets, G., Roueff, E., Dalgarno, A., & Gredel, R. 1995a, ApJ, 449, 178 [NASA ADS] [CrossRef] [Google Scholar]
- Le Bourlot, J., Pineau des Forets, G., Roueff, E., & Flower, D. R. 1995b, A&A, 302, 870 [NASA ADS] [Google Scholar]
- Le Petit, F., Nehmé, C., Le Bourlot, J., & Roueff, E. 2006, ApJS, 164, 506 [NASA ADS] [CrossRef] [EDP Sciences] [Google Scholar]
- Le Petit, F., Barzel, B., Biham, O., Roueff, E., & Le Bourlot, J. 2009, A&A, 505, 1153 [NASA ADS] [CrossRef] [EDP Sciences] [Google Scholar]
- Lemaire, J. L., Vidali, G., Baouche, S., et al. 2010, ApJ, 725, L156 [Google Scholar]
- Lipshtat, A., & Biham, O. 2003, A&A, 400, 585 [NASA ADS] [CrossRef] [EDP Sciences] [Google Scholar]
- Lipshtat, A., Biham, O., & Herbst, E. 2004, MNRAS, 348, 1055 [NASA ADS] [CrossRef] [Google Scholar]
- Lohmar, I., & Krug, J. 2006, MNRAS, 370, 1025 [NASA ADS] [CrossRef] [Google Scholar]
- Lohmar, I., Krug, J., & Biham, O. 2009, A&A, 504, L5 [NASA ADS] [CrossRef] [EDP Sciences] [Google Scholar]
- Mathis, J. S., Rumpl, W., & Nordsieck, K. H. 1977, ApJ, 217, 425 [NASA ADS] [CrossRef] [Google Scholar]
- Mathis, J. S., Mezger, P. G., & Panagia, N. 1983, A&A, 128, 212 [NASA ADS] [Google Scholar]
- Rachford, B. L., Snow, T. P., Destree, J. D., et al. 2009, ApJS, 180, 125 [NASA ADS] [CrossRef] [Google Scholar]
- Sakong, S., & Kratzer, P. 2010, J. Chem. Phys., 133, 054505 [NASA ADS] [CrossRef] [Google Scholar]
- Schöier, F. L., van der Tak, F. F. S., van Dishoeck, E. F., & Black, J. H. 2005, A&A, 432, 369 [NASA ADS] [CrossRef] [EDP Sciences] [Google Scholar]
- Sheffer, Y., Rogers, M., Federman, S. R., et al. 2008, ApJ, 687, 1075 [NASA ADS] [CrossRef] [Google Scholar]
- Sheffer, Y., Wolfire, M. G., Hollenbach, D. J., Kaufman, M. J., & Cordier, M. 2011, ApJ, 741, 45 [NASA ADS] [CrossRef] [Google Scholar]
- Sizun, M., Bachellerie, D., Aguillon, F., & Sidis, V. 2010, Chem. Phys. Lett., 498, 32 [NASA ADS] [CrossRef] [Google Scholar]
- van Dishoeck, E. F. 1988, in Rate Coefficients in Astrochemistry, Proc. Conf. UMIST, UK, 1987, ed. T. J. Millar, & D. A. Williams (Dordrecht, Boston: Kluwer Acad. Publ.), 49 [Google Scholar]
- Weingartner, J. C., & Draine, B. T. 2001, ApJS, 134, 263 [NASA ADS] [CrossRef] [MathSciNet] [Google Scholar]
- Wolfire, M. G., Hollenbach, D., McKee, C. F., Tielens, A. G. G. M., & Bakes, E. L. O. 1995, ApJ, 443, 152 [Google Scholar]
All Tables
Grain parameters and elemental abundances, where Fe represents a generic metallic ion.
Model results for P = 105 cm-3 K and three different radiation field enhancements.
Abscissae and weights for the Gaussian integration of a MRN size distribution with npg = 12, α = 3.5, amin = 3 × 10⁻⁷ cm, and amax = 3 × 10⁻⁵ cm.
Critical densities in the LH formation rate of H2 for amorphous carbon and a mean distance between physisorbed sites of 2.6 Å , where T is the gas temperature in K.
All Figures
|
Fig. 1 Respective weight of ER H2 formation and photo-electric heating in a high-density PDR. Here the density is nH = 106 cm-3 and the radiation field G0 = 103. The temperature profile is fixed and has been explicitly chosen to illustrate the importance of ER heating at high temperature. |
| In the text | |
|
Fig. 2 Intensity of H2 lines in erg cm-2 s-1 sr-1 seen in a face-on geometry, for model C, a) 0–0 S(0), b) 0–0 S(1), c) 0–0 S(2), and d) 0–0 S(3). |
| In the text | |
|
Fig. 3 Intensity of H2 lines in erg cm-2 s-1 sr-1 seen in a face-on geometry, for model C, a) 1–0 S(0), b) 1–0 S(1), c) 1–0 S(2), and d) 1–0 S(3). |
| In the text | |
|
Fig. 4 Intensity of H2 lines in erg cm-2 s-1 sr-1 seen in a face-on geometry, for model C, a) 2–1 S(1), b) 2–1 S(2), and c) 2–1 S(3). |
| In the text | |
|
Fig. 5 Intensity of O at 63 and 145 μm in erg cm-2 s-1 sr-1 seen in a face-on geometry, for model C. |
| In the text | |
|
Fig. 6 Intensity of C + at 157.63 μm in erg cm-2 s-1 sr-1 seen in a face-on geometry, for model C. |
| In the text | |
|
Fig. C.1 Left axis: variation of kER with gas temperature T (relative to the one at 100 K). Right axis: chemisorption efficiency κ (see text). |
| In the text | |
|
Fig. C.2 Effect of the variations in T1 and T2 on the intensity of H2 1–0 S(1) line for the model P = 107 cm-3 K and χ = 1000. Values plotted in the plane T1,T2 are I(T1,T2)/I(300,464). |
| In the text | |
Current usage metrics show cumulative count of Article Views (full-text article views including HTML views, PDF and ePub downloads, according to the available data) and Abstracts Views on Vision4Press platform.
Data correspond to usage on the plateform after 2015. The current usage metrics is available 48-96 hours after online publication and is updated daily on week days.
Initial download of the metrics may take a while.