| Issue |
A&A
Volume 541, May 2012
|
|
|---|---|---|
| Article Number | A76 | |
| Number of page(s) | 17 | |
| Section | Interstellar and circumstellar matter | |
| DOI | https://doi.org/10.1051/0004-6361/201118126 | |
| Published online | 01 May 2012 | |
Online material
Appendix A: Other recent updates to the PDR code
Progress have been achieved in computing fine structure and rotational excitation due to collisions with H and/or H2 as reported in the BASECOL (Dubernet et al. 2006) and LAMDA (Schöier et al. 2005) databases. We have updated and/or implemented the collisional excitation rates that play an active role in the cooling processes and computed explicitly their emission spectrum by solving the statistical equilibrium equations, including radiative pumping by the cosmic background radiation field and dust infrared emission (Gonzalez Garcia et al. 2008). We point out that the new fine-structure excitation collision rates of atomic oxygen computed by Abrahamsson et al. (2007) have a significant impact on the temperature at the edge of PDRs. As an example, for a typical proton density of 104 cm-3 and a radiation scaling factor of 10, the temperature at the edge is 90 K with the old Launay & Roueff (1977) atomic oxygen collision rates and only 67 K with the values displayed in Abrahamsson et al. (2007). At the present stage, the emission spectra of millimeter and submillimeter transitions of HCN, OH, CH + , and O2 are readily computed and the implementation of other molecules is straightforward and depends only on the availability of the collision rates by the relevant perturbers. Another significant issue is the inclusion of the thermal and charge balance of the grains in the overall ionization fraction. The thermal balance is obtained through a coupling with the DustEM program Compiègne et al. (2011), which can be switched on through the F_Dustem parameter (F_Dustem=1). If not (F_Dustem=0), the temperature of the various grain bin sizes is obtained from the formula given in Eq. (5) of Hollenbach et al. (1991), where the actual value of the radiation field is introduced. The determination of the grain charge is obtained from the balance between photoelectric effect and recombination on dust particles, expanding on the treatment of Draine & Sutin (1987) and Bakes & Tielens (1994).
The code also computes the photodissociation rates from the integration of the photodissociation cross-sections, when available, with the interstellar radiation field. The attenuation by dust particles is then directly obtained from the dust properties considered in the model, i.e. their absorption and extinction coefficients, which depend on the size and the nature of the dust particles. Different options are proposed depending on the treatment of the grain temperatures. If F_Dustem=1, we use the absorption and scattering coefficients computed by the DustEM code (Compiègne et al. 2011). If F_Dustem=0, we derive the albedo and dust properties from the extinction curve given by the Fitzpatrick and Massa analytic expansion (Fitzpatrick & Massa 2007), extended towards longer wavelengths by the data from Weingartner & Draine (2001)4. It is remarkable that we recover the dust-free photodissociation rates displayed in van Dishoeck (1988) for the Mathis or Draine incident radiation field. The AV dependence of the photodissociation rates then directly reflects the appropriate dust environment.
Appendix B: Langmuir-Hinshelwood mechanism
Upon landing on a grain, most heavy species may build an ice mantle. In this case, it is possible to account for the total number of physisorbed molecules by integrating over the grain size distribution. This is the subject of a forthcoming paper on surface chemistry (Le Petit et al., in prep.). However, this is most probably not the case for the lightest species (H, H2, D, HD, ...). We assume here that they only build a single monolayer above either the grain surface or the ice mantle.
In that case, two effects must be taken into account:
-
upon landing on a site already occupied by a light species, theimpinging species is rejected to the gas phase;
-
binding depends on the (size-dependent) temperature of the grain and thus the steady state depends on the size (and characteristics) of the grain.
Hence, we must compute the number of physisorbed particles of type X on a grain of size a. This is NX:(a) in the following (in particles per grain, and not in particles per cubic centimeter). The total amount of X on all grains, that follows by integration, is  where the last expression is for a MRN size distribution with dng = Agr nH a − α da. Agr is a normalization factor, nH is the gas density (in cm-3), and a the grain radius (in cm). In the following, we use that case as an example, but it is easy to generalize to any distribution. Numerical integration is performed by discretizing the size. When needed, we use
  where the weights wi and abscissae ai are chosen according to the distribution. The number of abscissae is npg. Table B.1 displays the abscissae and weights computed for the parameters of the MRN distribution given in Table 1. These coefficients must be computed anew whenever one changes the range of sizes5. Here
 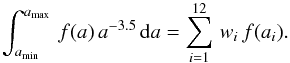 Remark that the power a-3.5 does not appear in the discrete sum.
Abscissae and weights for the Gaussian integration of a MRN size distribution with npg = 12, α = 3.5, amin = 3 × 10⁻⁷ cm, and amax = 3 × 10⁻⁵ cm.
Three types of reactions must be considered:
-
Adsorption;
-
Ejection;
-
Reaction.
We do not consider reactions with heavy atoms nor molecules (including ices) which will be the subject of a follow-up paper.
B.1. Adsorption
If the outer layer of the grain is populated by light species (H, H2), then any one of them may lead to the rejection of an impinging atom. We consider nj of these species. The number of accretion events of a species X per unit time interval on a single grain of size a is then 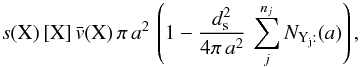 where s(X) is the sticking coefficient of species X, ds the mean distance between adsorption sites (assumed to be identical for all grains), and the term in parentheses takes into account rejection by any species Yj that is already on the grain. The term
  is the total number of adsorption sites on a grain of size a. Formally, this equation may be divided into a first-order formation reaction of rate
 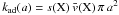 , and nj different second-order destruction reactions of rate
  . The relevant creation and destruction equations are thus
 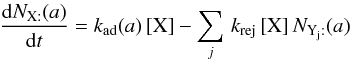 (B.1)
(B.1) or
or  (B.2)where Sgr is the total surface of grains per unit volume. One can see that, although the form of the reaction terms is preserved (first or second order polynomials in the variables) the total number of individual contributions becomes large (one accretion leads to (nj × npg + 1) reactions)6.
B.2. Desorption processes
Ejection can occur spontaneously (thermal evaporation) or by either photo-desorption or cosmic-ray ejection. All processes are similar in the sense that they only involve a single variable NX(a) for a grain of size a.
If the vibration frequency of the adsorbed particle is ν0, the temperature of the grain is Tgr(a), and the binding energy is Tb(X), then the number of evaporation per unit time is  If the flux of photons (respectively cosmic rays) is Fph (respectively FCR) and the number of particles desorbed by impact is ηph (respectively ηCR), then the number of desorption is (for a photon)
  Writing
  ,
,  and
and  , we have
  (B.3)
(B.3) (B.4)
(B.4)
B.3. Surface reactions
We seek to compute the number of encounters per grain and per unit time. We adopt first the point of view of X:. On a single grain of size a, the number of encounter per s is proportional to 1/tX the inverse hoping time of X:, the probability of finding a Y: upon landing and the number of X: 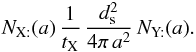 During the same time, from the point of view of Y:, the number of encounters made is
  So the total number of encounters is
  where the factor of
  takes care of each encounter having been counted twice. Thus, for two surface species, we can write
  , and
, and  (B.5)The production rate of Z in the gas phase, occurring directly after the encounter of two adsorbed atoms, is obtained after integration on the grain size distribution
  (B.6)
(B.6)
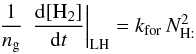
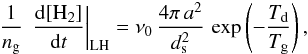
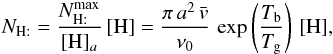
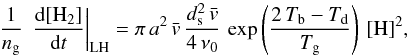
B.4. Approximate H2 formation rate
For a single grain size, and negligible photodesorption and cosmic-ray desorption, we can derive an analytic approximation to the H2 formation rate in the spirit of the discussion of Biham & Lipshtat (2002). If H is the only atom sticking to a grain of size a with a sticking probability of 1, then  In a steady state, this leads to
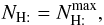
  (B.7)where
  is the maximum number of H on the grain, and the two critical densities [H] a and[H] b are defined as
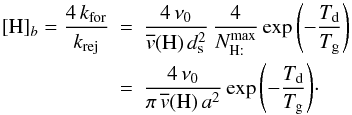 Table B.2 gives the values of the critical densities for different grain temperatures.
Critical densities in the LH formation rate of H2 for amorphous carbon and a mean distance between physisorbed sites of 2.6 Å , where T is the gas temperature in K.
The H2 formation rate per grain is then (with ng the number of grains per cubic centimeter of gas =  )
)  and can be given analytically from the previous formulae. Both [H] a and[H] b vary slowly with the gas temperature, but very strongly with the grain temperature. Thus, we can define two limiting regimes for the gas phase atomic hydrogen density, namely
 This is possible only for cold grains (typically below 15 K). Hence, it requires both a high density (or pressure) and a weak radiation field.
 This is the case for all grain sizes as soon as Tg is higher than about 25 K. Hence, it applies to all strong radiation field models. In that case, the formation rate increases as the square of the density of H.
The usual expression for the formation rate RH2 in cm3 s-1 follows from 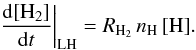 Since ng is proportional to nH, we see that in the first case RH2 ∝ 1/[H] , whereas in the second RH2 ∝ [H] . These relations apply only for the approximations made here.
Appendix C: Eley-Rideal mechanism
C.1. Formalism
We consider the impact of a fast atom (hot gas) on a grain. Since a fully detailed description (taking into account all possible kinds of surfaces) is far beyond the capabilities of our model, we search for an approximate mechanism that takes into account the following requirements:
-
it is efficient in “hot” gas and on “hot” grains, hence the impinging Hatom must eventually reach a chemisorbed site on the grain;
-
it leads to H2 formation rates that are consistent with observational constraints;
-
the number of free parameters remains at the lowest possible number.
Since this process takes place at the edge of the cloud, we assume that the grains are essentially bare (without ice coating) and that the process does not depend on the grain temperature. This approximation is justified since, at the edge of PDRs, grain temperatures (at most 100 K) are much lower than either the gas temperature or chemical binding energies on grain surfaces.
On impact, the gas phase H can find either a free chemisorpsion site or an already chemisorbed H. In the second case, since the formation of H2 releases 4.5 eV, an energy far higher than the chemisorbed well, we assume that a newly formed H2 is immediately released in the gas phase. Hence 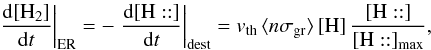 where [H::] max is the maximum number of chemisorbed H atoms (saturated grains) and [H::] the corresponding abundance. In addition vth is the thermal velocity of the gas phase H and we consider the geometrical cross-section to compute the total amount of grain surface per unit volume ⟨ nσgr ⟩ . If the mean distance between chemisorption sites is ds and is the same on all types of grains, one can see (from purely geometric considerations) that
  This is true for any grain size distribution. If the gas phase atom impacts a free chemisorption site, we have to estimate the probability that it sticks to the grain. The simplest hypothesis requires that it be proportional to the number of collisions of H with grains per unit of time (vth ⟨ nσgr ⟩ ), possibly with a barrier to cross
  (where T is the gas temperature and T1 the threshold), with a temperature dependent sticking coefficient α(T) and proportional to the “free room”
  . Hence we write
 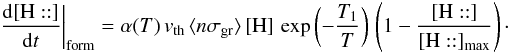 This equation is split in the code into two: a direct formation reaction and a “pseudo” rejection reaction. The corresponding rates are
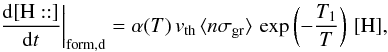

C.2. Sticking coefficient and choice of T1
There is not much information on how to define the sticking function α(T), but we expect that it goes to 0 for very high temperatures (the atom just bounces on the grain without there being any time to evacuate the excess kinetic energy). We introduce the empirical form 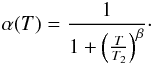 (C.1)In this expression, the index β controls the steepness of the decrease in α(T), and T2 defines the temperature such that
  .
.
We may constrain the value of β with the following considerations:
-
an estimate of the velocity v2 above which theatom bounces back to the gas is given by

-
the sticking coefficient is approximated as the fraction of gas phase atom with velocity lower than v2. Using a Maxwell distribution at temperature T, we have

 . Defining T2 by
  , we get
  This shows that
  in Eq. (C.1) is exact. The prefactor is 1.08, which we can take as 1 given the approximations involved; thus Eq. (C.1) is a good approximation over the whole temperature range. The estimate of v2 gives T2 in the range 400 − 500 K7.
Given α(T), we may investigate which barrier T1 gives a “standard” formation rate of 3 × 10-17 cm3 s-1 at a given temperature T. We find that  Postulating that where grains are warm, the gas is warm too, we may require that this standard rate is reached for a temperature in the range [150:450] K. This translate into a range [100:800] K for T1. Our choice of T1 = 300 K favors an efficient formation, and reflects the idea that chemisorption is easy (but not instantaneous) on grains with plenty of surface defects. This leads to a higher formation rate at high gas temperature as found observationally by Habart et al. (2004).
C.3. Analytical approximation
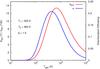 |
Fig. C.1
Left axis: variation of kER with gas temperature T (relative to the one at 100 K). Right axis: chemisorption efficiency κ (see text). |
| Open with DEXTER | |
If hydrogen is the only chemisorbed species, the abundance of H:: can be analytically derived at a steady state  which leads to an H2 formation rate of
 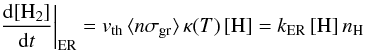 (C.2)with
 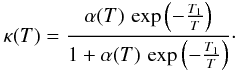 In this expression, vth ⟨ nσgr ⟩ [H] refers to a purely geometric collisional process. Figure C.1 displays the variation in the chemisorption rate as a function of gas temperature (relative to the one at 100 K). The rate is negligible at low temperature owing to the exponential barrier. It grows as the square root of T where the barrier is negligible, then is quenched by the sticking cutoff. The chemisorption efficiency, κ(T), is displayed in Fig. C.1 (right axis). It peaks at a few hundred Kelvin and remains significantly high up to a few thousands of Kelvin.
This behavior is qualitatively very similar to results found by Cuppen et al. (2010, their Fig. 2) from Monte Carlo simulations of H2 formation including both physisorption and chemisorption. They also found that the formation efficiency increases with temperature for gas temperatures around a thousand K.
 |
Fig. C.2
Effect of the variations in T1 and T2 on the intensity of H2 1–0 S(1) line for the model P = 107 cm-3 K and χ = 1000. Values plotted in the plane T1,T2 are I(T1,T2)/I(300,464). |
| Open with DEXTER | |
In Sect. 4.2.2, we present several line intensities computed from models in which H2 is formed by the ER and LH mechanisms. In these models, we adopted β = 1.5, T1 = 300 K, and T2 = 464 K. Figure C.2 presents the effect of variations in T1 and T2 on the intensity of one line of H2. We note that T1 is the most important parameter and that the line intensity can be reduced by
a factor ≃ 5 if this parameter is increased from 300 K to 1000 K. For other lines, such as 0–0 S(0) this decrease can reach a factor of ten. As mentioned above, for real interstellar grains, we can expect to have a large range of T1 depending on the nature and structure of the grains surfaces. Even if most chemisorbed sites have high thresholds, it only requires a few low thresholds sites for the ER mechanism to be efficient.
Appendix D: AV to size conversion
For constant dust properties along the line of sight, it is possible to convert optical depth in the visible to a distance (in pc) analytically. We define Cd to be the total proton column-density to color index ratio, and RV the usual extinction to color index ratio:  Then, using AV = 2.5 log 10(e) τV, we have
  hence, with
 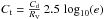 , we have
 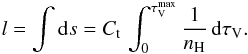 We note that
  , where κV + σV is the extinction (sum of absorption plus scattering) per H atom by grains at the wavelength of the photometric band V.
© ESO, 2012
Current usage metrics show cumulative count of Article Views (full-text article views including HTML views, PDF and ePub downloads, according to the available data) and Abstracts Views on Vision4Press platform.
Data correspond to usage on the plateform after 2015. The current usage metrics is available 48-96 hours after online publication and is updated daily on week days.
Initial download of the metrics may take a while.