| Issue |
A&A
Volume 540, April 2012
|
|
|---|---|---|
| Article Number | L7 | |
| Number of page(s) | 4 | |
| Section | Letters | |
| DOI | https://doi.org/10.1051/0004-6361/201218890 | |
| Published online | 28 March 2012 | |
Damping rates of solar-like oscillations across the HR diagram
Theoretical calculations confronted to CoRoT and Kepler observations
1 LESIA, UMR8109, Université Pierre et Marie Curie, Université Denis Diderot, Obs. de Paris, 92195 Meudon Cedex, France
e-mail: kevin.belkacem@obspm.fr
2 Institut d’Astrophysique et de Géophysique, Université de Liège, Allée du 6 Août 17, 4000 Liège, Belgium
3 Institut d’Astrophysique Spatiale, CNRS, Université Paris XI, 91405 Orsay Cedex, France
4 Georg-August-Universität Göttingen, Institut für Astrophysik, Friedrich-Hund-Platz 1, 37077 Göttingen, Germany
Received: 26 January 2012
Accepted: 7 March 2012
The space-borne missions CoRoT and Kepler are providing a rich harvest of high-quality constraints on solar-like pulsators. Among the seismic parameters, mode damping rates remains poorly understood and are thus barely used to infer the physical properties of stars. Nevertheless, thanks to the CoRoT and Kepler spacecrafts it is now possible to measure damping rates for hundreds of main-sequence and thousands of red-giant stars with unprecedented precision. By using a non-adiabatic pulsation code including a time-dependent convection treatment, we compute damping rates for stellar models that are representative of solar-like pulsators from the main-sequence to the red-giant phase. This allows us to reproduce the observations of both CoRoT and Kepler, which validates our modeling of mode damping rates and thus the underlying physical mechanisms included in the modeling. By considering the perturbations of turbulent pressure and entropy (including the perturbation of the dissipation rate of turbulent energy into heat) by the oscillation in our computation, we succeed in reproducing the observed relation between damping rates and effective temperature. Moreover, we discuss the physical reasons for mode damping rates to scale with effective temperature, as observationally exhibited. Finally, this opens the way for the use of mode damping rates to probe turbulent convection in solar-like stars.
Key words: asteroseismology / convection / stars: oscillations / stars: solar-type
© ESO, 2012
1. Introduction
The space missions CoRoT and Kepler are providing accurate observations of solar-like oscillations of hundreds of main-sequence stars and thousands of red-giant stars. Therefore, we now have access to seismic properties, such as mode frequencies, amplitudes, and linewidths, for a large and homogeneous sample of stars. Among them, the physical mechanisms governing mode linewidths (Γ), which is linearly related to mode damping rates (η) such as Γ = η/π, are still poorly understood. Many studies have attempted to model the damping rates of solar modes (e.g., Balmforth 1992; Dupret et al. 2006a; Xiong et al. 2000). All those modelings have had difficulties in reproducing the solar observations except when using free parameters, and the underlying physical mechanisms remain unclear (e.g., Houdek 2008).
The scaling relation of mode linewidths for other stars thus provides an important additional constraint on the modeling. A usual way to investigate mode parameters adopts scaling relations between asteroseismic quantities and stellar parameters (e.g. Kjeldsen & Bedding 1995; Samadi et al. 2007; Mosser et al. 2010; Baudin et al. 2011; Belkacem et al. 2011). For mode linewidths, scaling relations have been investigated only very recently. Chaplin et al. (2009) used ground-based observations and proposed that mode linewidths follow a power-law dependence on effective temperature, i.e.  where Γ is the mode linewidth and Teff the effective temperature. However, those conclusions were challenged by Baudin et al. (2011) using a homogeneous sample of stars observed by CoRoT. They found that a unique power-law cannot describe the entire range of effective temperature covered by main-sequence and red-giant stars and concluded that mode linewidths of main-sequence stars follow a power-law of
  , while red-giant stars only slightly depend on effective temperature (
 ). This result, for main-sequence and sub-giant stars, was later extended by Kepler observations (Appourchaux et al. 2012).
From a theoretical point of view, Chaplin et al. (2009) predicted a power-law of , which disagrees with CoRoT and Kepler observations. Houdek (2012) attributed the failure of this theory to a missing physical mechanism and proposed mode scattering as a possible solution. This disagreement emphasizes that our understanding of mode linewidth is still in its infancy and that a first necessary breakthrough would be to reproduce the CoRoT and Kepler observations. Hence, in this letter we adopt the formalism of Grigahcène et al. (2005) and Dupret et al. (2006b). This allows us to confront theoretical computations with observations from both the CoRoT and Kepler spacecrafts, and consequently to understand the strong dependence of mode linewidth on effective temperature and validate the theoretical modeling.
2. Computation of theoretical damping rates
2.1. The grid of stellar models
We used a grid of stellar models for masses between M = 1 M⊙ and M = 1.4 M⊙ from the ZAMS to the tip of the red giant branch, which are typical of observed solar-like pulsators. The grid was obtained using the stellar evolution code CESAM2k (Morel & Lebreton 2008). The atmosphere was computed assuming a grey Eddington approximation. Convection was included according to the Böhm-Vitense mixing-length (MLT) formalism, with a mixing-length parameter α = 1.6. The initial chemical composition follows Asplund et al. (2005), with an helium mass fraction of 0.2485. We used the OPAL equation of state (Rogers et al. 1996) and opacities (Iglesias & Rogers 1996), complemented, at T < 104 K, by the Alexander & Ferguson (1994) opacities. We used the NACRE nuclear reaction rates from Angulo et al. (1999) except for the 14 N + p reaction, where we used the reaction rates given in Imbriani et al. (2004).
2.2. The non-adiabatic oscillation code
Damping rates were computed using the non-adiabatic pulsation code MAD (Dupret 2001), which includes the time-dependent convection (TDC) treatment described in Grigahcène et al. (2005). This approach takes into account the role played by the variations in the convective flux, the turbulent pressure, and the dissipation rate of turbulent kinetic energy. This TDC approach is a non-local formulation of convection based on the Gabriel (1996) formalism explained in Dupret et al. (2006b,a). In this framework, non-local parameters related to the convective flux and the turbulent pressure are chosen such as in Dupret et al. (2006b) so that it fits the solar 3D numerical simulation.
In addition, it involves a parameter β, which takes complex values and enters the closure term of the perturbed energy equation. This parameter was introduced to prevent the occurrence of non-physical spatial oscillations in the eigenfunctions (see Grigahcène et al. 2005,for details). To constrain this parameter, we adopt the following strategy: β is adjusted so that the frequency of the depression of the damping rates (see Fig. 1) coincides with νmax, where νmax is computed by using the linear relation between νmax and the cut-off frequency (e.g., Kjeldsen & Bedding 1995). We note that the bond between νmax and the frequency of bottom of the second ascending branch of the damping rates is observed for the Sun (Belkacem et al. 2011) and more generally for solar-like pulsators (Appourchaux et al. 2012).
2.3. Dominant contributions of the damping rates
The integral expression of the damping rates can be written as (Grigahcène et al. 2005) ![\begin{equation} \label{dampings_radiatif} \eta = \frac{1}{2 \, \omega I} \int_{0}^{M} \mathcal{I}m \left[ \left(\Gamma_3 - 1\right) \, \frac{\delta \rho}{\rho_0}^* T_0 \delta S + \frac{\delta \rho}{\rho_0}^* \frac{\delta P_{\rm turb}}{\rho_0} \right] \textrm{d}m \, , \end{equation}](/articles/aa/full_html/2012/04/aa18890-12/aa18890-12-eq15.png) (1)where ω is the mode frequency, I the mode inertia, (Γ3 − 1) = (∂lnT0/∂lnρ0)s, δρ the Lagrangian perturbation of density, δS is the Lagrangian perturbations of entropy, δPturb the perturbation of turbulent pressure, T0 the mean temperature, ρ0 the mean density, and the star denotes the complex conjugate.
(1)where ω is the mode frequency, I the mode inertia, (Γ3 − 1) = (∂lnT0/∂lnρ0)s, δρ the Lagrangian perturbation of density, δS is the Lagrangian perturbations of entropy, δPturb the perturbation of turbulent pressure, T0 the mean temperature, ρ0 the mean density, and the star denotes the complex conjugate.
The first term of Eq. (1) includes the contributions of the perturbations of the radiative and convective fluxes, as well as the perturbation of the dissipation rate of turbulent kinetic energy into heat. We note that this term corresponds to the non-adiabatic part of the gas pressure perturbation, which is found to be negative (thus a driving contribution). The second term of Eq. (1) represents the perturbation of turbulent pressure. Figure 1 displays the mode damping versus the mode frequency as well as the two contributions expressed in Eq. (1). It turns out that the contribution of turbulent pressure dominates the damping and is partly compensated by the contribution of entropy. Both contributions have roughly the same order of magnitude, hence the total mode damping is small compared to the absolute values of both the entropy and turbulent pressure contributions. In addition, we note that the depression (or plateau) of the damping rates is the result of the maximum compensation between the two contributions. This is the case for all the models, from the main-sequence to the red-giant phases.
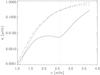 |
Fig. 1 Damping rates versus mode frequency, computed for a model of a mass of M = 1.1 M⊙ and an effective temperature of Teff = 6026 K on the main sequence. The damping has been computed as described in Sect. 2.2. The solid line corresponds to the total damping rate, while the dash-dotted line corresponds to the contribution of the perturbation of turbulent pressure and the dashed line to the absolute value of the contribution of the entropy perturbations (see Eq. (1)). The vertical dotted line corresponds to νmax. |
3. Comparison with CoRoT and Kepler observations
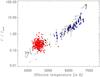 |
Fig. 2 Mode linewidths (normalized by the solar value, Γsun = 0.95 μHz) versus effective temperature. The squared symbols represent theoretical calculations computed as explained in Sects. 2.1 and 2.2. The triangles correspond to the observations of main-sequence stars derived by Appourchaux et al. (2012) from the Kepler data (with their 3-σ error-bars). The dots correspond to the observations of red giants (with Teff < 5200 K) and main-sequence (with Teff > 5200 K, with their 3-σ error-bars) stars as derived by Baudin et al. (2011) from the CoRoT data. |
3.1. Data set
We considered CoRoT and Kepler stars for which linewidths had been accurately measured. We first considered the CoRoT observations described in Baudin et al. (2011). The measured linewidths for main-sequence stars come from the CoRoT seismological field. More precisely, we used HD49933 (Benomar et al. 2009), HD181420 (Barban et al. 2009), and HD49385 (Deheuvels et al. 2010). We also used the results for HD50890 (Baudin et al. 2012), HD181907 (Carrier et al. 2010), and the Sun. For CoRoT red-giants, Baudin et al. (2011) fitted 235 red giants observed in the exo-field of CoRoT for about 142 days.
We also considered Kepler observations of 42 stars acquired over nine months as presented by Appourchaux et al. (2012). Those stars were analyzed by several groups and mode linewidths at the maximum of height in the power spectrum were derived. We note that Appourchaux et al. (2012) considered only main-sequence stars and sub-giants but not red giants.
3.2. Results
A direct comparison between observations and theoretical computations is provided in Fig. 2 for both Kepler and CoRoT observations. For main-sequence stars, there is an overall agreement between the theoretical computations and both CoRoT and Kepler observations within the observational error-bars. However, the observed Kepler linewidths are smaller than predicted by theory and this is particularly the case for stars with high effective temperatures. While this result can be related to modeling deficiencies, there are also several possible observational uncertainties. For instance, the determination of effective temperature is subject to important uncertainties in the estimation of the mode linewidth (Appourchaux et al. 2012).
For red-giant stars, our theoretical computation is in overall agreement with the results derived for CoRoT observations by Baudin et al. (2011). We note however that possible uncertainties can also come from either the determination of effective temperatures or a bias due to the observation duration and thus the limited frequency resolution in Baudin et al. (2011). An extended investigation of damping rates dedicated to red-giant stars would thus be desirable in a future work, and allow us to draw conclusions about the dependence of effective temperature to damping rates for red-giants. In addition, such a work will benefit from ongoing Kepler observations that will provide us red giants at low effective temperatures (Teff < 4200 K).
This overall agreement with both CoRoT and Kepler observations demonstrates that the main physical picture is well-reproduced by the modeling. However, an extension of this comparison using sub-giants and high luminosity red-giant stars observed by Kepler is desirable in the future to ensure that we have a homogeneous sample of stars across a large range of effective temperatures.
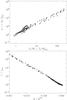 |
Fig. 3 Top: product η × I (see Eq. (1) for details) as a function of the ratio L/M (where L and M are the luminosity and mass, respectively). Bottom: mode inertia versus the cut-off frequency, computed as the ratio g (where g is the surface gravity). |
4. Discussions
We have discussed the strong dependence of mode damping rates on effective temperature and shown that it can be understood by simple arguments. Secondly, we have investigated the possible origin of a different scaling for the damping rates of main-sequence and red-giant stars.
4.1. Mode linewidth versus effective temperature
We start from Eq. (1) and note that there are obviously two important quantities, the work integral and the mode inertia. The first depends on the phase difference between the mode compression (perturbation of density) and perturbation of pressure (gas and turbulent pressure). Hence, it is the non-adiabatic part of pressure fluctuations (δS/cv) that mainly determines the mode damping. According to the mode energy equation (see, for instance, Eq. (A.2) of Belkacem et al. 2011), one can expect that the work integral dimensionally scales as the ratio L/M. This is confirmed by Fig. 3 (top), which shows that the work integral follows 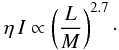 (2)In contrast, mode inertia (I) does not depend on mode energy leakage but on the star’s static structure and more precisely on the properties of the uppermost layers. Hence, one can expect mode inertia to scale with the surface gravity1 as in the case shown by Fig. 3 (bottom). More precisely,
  (3)Now using Eqs. (2) and (3) and further noting that
  , one easily finds that mode damping depends mainly on effective temperature, such that
 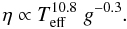 (4)Such a crude analysis is unable to reproduce the precise shape of the mode line-width with effective temperature. However, it allows us to explains qualitatively the strong dependence of mode damping rates on effective temperature. It turns out that the dependence on the effective temperature is a result of a compensation between the work integral and mode inertia.
4.2. Main-sequence and red-giants stars: two physical regimes?
Several authors (Ando et al. 2010; Baudin et al. 2011) have shown by using both ground-based observations and photometric observations from space that there is an apparent change in the behavior of the mode damping rates between main-sequence and red-giant stars. They therefore suggested that there is a switch between two different physical regimes. However, our theoretical results suggest that the physical mechanisms for mode damping remain the same from main-sequence to red-giant stars.
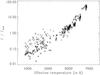 |
Fig. 4 As for Fig. 2. Double cross symbols correspond, as described in Sect. 3, to damping rates computed for the closest mode in frequency to the frequency of the maximum νmax, minus one radial order. The crosses correspond to the same calculation but adding one radial order for the selection of the frequency of the maximum. This procedure is intended to mimic the effect of possible biases in the observational determination of νmax. |
However, the power-law of mode damping with effective temperature is very sensitive to the way νmax is selected. This is illustrated by Fig. 4. For instance, a bias in selecting νmax can arise because in red giants some non-radial modes have almost the same widths as radial ones (Dupret et al. 2009). For main-sequence stars, the mode density is important so that an error of, say, one radial order in the selection of νmax has negligible effects. In contrast, for red giants, this shift can lead to the selection of a mode outside the depression of the damping rates. Hence, we conclude that the slope of mode linewidth, for red-giants, with effective temperature is sensitive to the way in which the frequency of the maximum height is derived in each power spectrum. In turn, it could also explain why
Appourchaux et al. (2012) found different results from their fitting when the frequency of the maximum height or amplitude was selected.
5. Conclusions
In contrast to previous work, we have shown that the theoretical computation of mode damping rates agree with both Kepler and CoRoT observations from main-sequence to red-giant stars. This result suggests that the main physical picture used to model mode damping successfully reproduces the observations. Moreover, we have been able to understand the strong dependence of mode damping rates on effective temperature by pointing out that it is the result of a compensation between the work integral and mode inertia.
In contradiction again to previous results our theoretical computation of mode damping rates with the same physics description are in agreement with both Kepler and CoRoT observations from main-sequence (strong relation with Teff) to red-giant stars, there being a large dispersion in the temperature range 4500 ± 250 K. Our results at lower temperature (Teff < 4200 K) again show that there is a strong dependence of the damping on Teff. Damping measurements for stars in this range using for example the ongoing Kepler mission will demonstrate whether our description is valid for this range and put tighter constraints on the relation for red giants.

References
- Alexander, D. R., & Ferguson, J. W. 1994, ApJ, 437, 879 [NASA ADS] [CrossRef] [Google Scholar]
- Ando, H., Tsuboi, Y., Kambe, E., & Sato, B. 2010, PASJ, 62, 1117 [NASA ADS] [Google Scholar]
- Angulo, C., Arnould, M., Rayet, M., et al. 1999, Nucl. Phys. A, 656, 3 [NASA ADS] [CrossRef] [Google Scholar]
- Appourchaux, T., Benomar, O., Gruberbauer, M., et al. 2012, A&A, 537, A134 [NASA ADS] [CrossRef] [EDP Sciences] [Google Scholar]
- Asplund, M., Grevesse, N., & Sauval, A. J. 2005, in Cosmic Abundances as Records of Stellar Evolution and Nucleosynthesis, ed. T. G. Barnes III, & F. N. Bash (San Francisco: ASP), ASP Conf. Ser., 336, 25 [Google Scholar]
- Balmforth, N. J. 1992, MNRAS, 255, 603 [NASA ADS] [CrossRef] [Google Scholar]
- Barban, C., Deheuvels, S., Baudin, F., et al. 2009, A&A, 506, 51 [NASA ADS] [CrossRef] [EDP Sciences] [Google Scholar]
- Baudin, F., Barban, C., Belkacem, K., et al. 2011, A&A, 529, A84; erratum, 2011, A&A, 535, C1 [NASA ADS] [CrossRef] [EDP Sciences] [Google Scholar]
- Baudin, F., Barban, C., Goupil, M. J., et al. 2012, A&A, 538, A73 [NASA ADS] [CrossRef] [EDP Sciences] [Google Scholar]
- Belkacem, K., Goupil, M. J., Dupret, M. A., et al. 2011, A&A, 530, A142 [Google Scholar]
- Benomar, O., Baudin, F., Campante, T. L., et al. 2009, A&A, 507, L13 [NASA ADS] [CrossRef] [EDP Sciences] [Google Scholar]
- Carrier, F., De Ridder, J., Baudin, F., et al. 2010, A&A, 509, A73 [NASA ADS] [CrossRef] [EDP Sciences] [Google Scholar]
- Chaplin, W. J., Houdek, G., Karoff, C., Elsworth, Y., & New, R. 2009, A&A, 500, L21 [NASA ADS] [CrossRef] [EDP Sciences] [Google Scholar]
- Deheuvels, S., Bruntt, H., Michel, E., et al. 2010, A&A, 515, A87 [NASA ADS] [CrossRef] [EDP Sciences] [Google Scholar]
- Dupret, M. A. 2001, A&A, 366, 166 [NASA ADS] [CrossRef] [EDP Sciences] [Google Scholar]
- Dupret, M. A., Barban, C., Goupil, M.-J., et al. 2006a, in Proceedings of SOHO 18/GONG 2006/HELAS I, Beyond the spherical Sun, ESA SP, 624, 97 [NASA ADS] [Google Scholar]
- Dupret, M.-A., Goupil, M.-J., Samadi, R., Grigahcène, A., & Gabriel, M. 2006b, in Proceedings of SOHO 18/GONG 2006/HELAS I, Beyond the spherical Sun, ESA SP, 624, 78 [NASA ADS] [Google Scholar]
- Dupret, M., Belkacem, K., Samadi, R., et al. 2009, A&A, 506, 57 [NASA ADS] [CrossRef] [EDP Sciences] [Google Scholar]
- Gabriel, M. 1996, Bull. Astron. Soc. India, 24, 233 [Google Scholar]
- Grigahcène, A., Dupret, M.-A., Gabriel, M., Garrido, R., & Scuflaire, R. 2005, A&A, 434, 1055 [NASA ADS] [CrossRef] [EDP Sciences] [Google Scholar]
- Houdek, G. 2008, Commun. Asteroseismol., 157, 137 [NASA ADS] [Google Scholar]
- Houdek, G. 2012, Proc. 61st Fujihara Seminar, Progress in solar/stellar physics with helio- and asteroseismology, ed. H. Shibahashi [arXiv:1201.0194] [Google Scholar]
- Iglesias, C. A., & Rogers, F. J. 1996, ApJ, 464, 943 [NASA ADS] [CrossRef] [Google Scholar]
- Imbriani, G., Costantini, H., Formicola, A., et al. 2004, A&A, 420, 625 [NASA ADS] [CrossRef] [EDP Sciences] [Google Scholar]
- Kjeldsen, H., & Bedding, T. R. 1995, A&A, 293, 87 [NASA ADS] [Google Scholar]
- Morel, P., & Lebreton, Y. 2008, Ap&SS, 316, 61 [NASA ADS] [CrossRef] [MathSciNet] [Google Scholar]
- Mosser, B., Belkacem, K., Goupil, M., et al. 2010, A&A, 517, A22 [NASA ADS] [CrossRef] [EDP Sciences] [Google Scholar]
- Rogers, F. J., Swenson, F. J., & Iglesias, C. A. 1996, ApJ, 456, 902 [NASA ADS] [CrossRef] [Google Scholar]
- Samadi, R., Georgobiani, D., Trampedach, R., et al. 2007, A&A, 463, 297 [NASA ADS] [CrossRef] [EDP Sciences] [Google Scholar]
- Xiong, D. R., Cheng, Q. L., & Deng, L. 2000, MNRAS, 319, 1079 [CrossRef] [Google Scholar]
All Figures
|
Fig. 1 Damping rates versus mode frequency, computed for a model of a mass of M = 1.1 M⊙ and an effective temperature of Teff = 6026 K on the main sequence. The damping has been computed as described in Sect. 2.2. The solid line corresponds to the total damping rate, while the dash-dotted line corresponds to the contribution of the perturbation of turbulent pressure and the dashed line to the absolute value of the contribution of the entropy perturbations (see Eq. (1)). The vertical dotted line corresponds to νmax. |
| In the text | |
|
Fig. 2 Mode linewidths (normalized by the solar value, Γsun = 0.95 μHz) versus effective temperature. The squared symbols represent theoretical calculations computed as explained in Sects. 2.1 and 2.2. The triangles correspond to the observations of main-sequence stars derived by Appourchaux et al. (2012) from the Kepler data (with their 3-σ error-bars). The dots correspond to the observations of red giants (with Teff < 5200 K) and main-sequence (with Teff > 5200 K, with their 3-σ error-bars) stars as derived by Baudin et al. (2011) from the CoRoT data. |
| In the text | |
|
Fig. 3 Top: product η × I (see Eq. (1) for details) as a function of the ratio L/M (where L and M are the luminosity and mass, respectively). Bottom: mode inertia versus the cut-off frequency, computed as the ratio g (where g is the surface gravity). |
| In the text | |
|
Fig. 4 As for Fig. 2. Double cross symbols correspond, as described in Sect. 3, to damping rates computed for the closest mode in frequency to the frequency of the maximum νmax, minus one radial order. The crosses correspond to the same calculation but adding one radial order for the selection of the frequency of the maximum. This procedure is intended to mimic the effect of possible biases in the observational determination of νmax. |
| In the text | |
Current usage metrics show cumulative count of Article Views (full-text article views including HTML views, PDF and ePub downloads, according to the available data) and Abstracts Views on Vision4Press platform.
Data correspond to usage on the plateform after 2015. The current usage metrics is available 48-96 hours after online publication and is updated daily on week days.
Initial download of the metrics may take a while.