Fig. 2
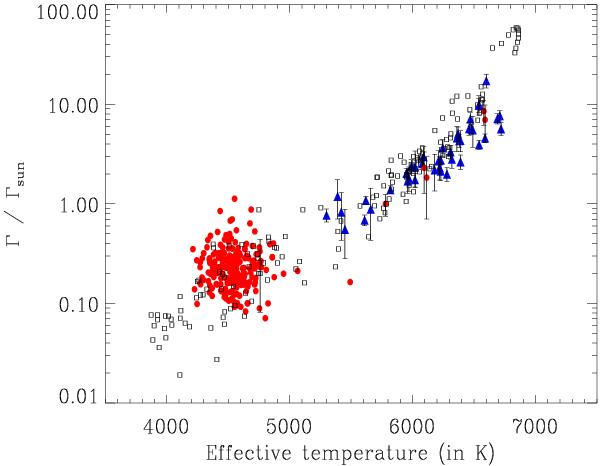
Mode linewidths (normalized by the solar value, Γsun = 0.95 μHz) versus effective temperature. The squared symbols represent theoretical calculations computed as explained in Sects. 2.1 and 2.2. The triangles correspond to the observations of main-sequence stars derived by Appourchaux et al. (2012) from the Kepler data (with their 3-σ error-bars). The dots correspond to the observations of red giants (with Teff < 5200 K) and main-sequence (with Teff > 5200 K, with their 3-σ error-bars) stars as derived by Baudin et al. (2011) from the CoRoT data.
Current usage metrics show cumulative count of Article Views (full-text article views including HTML views, PDF and ePub downloads, according to the available data) and Abstracts Views on Vision4Press platform.
Data correspond to usage on the plateform after 2015. The current usage metrics is available 48-96 hours after online publication and is updated daily on week days.
Initial download of the metrics may take a while.