Fig. 1
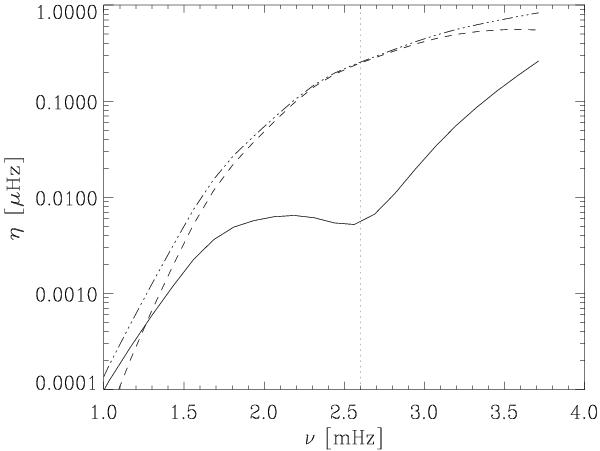
Damping rates versus mode frequency, computed for a model of a mass of M = 1.1 M⊙ and an effective temperature of Teff = 6026 K on the main sequence. The damping has been computed as described in Sect. 2.2. The solid line corresponds to the total damping rate, while the dash-dotted line corresponds to the contribution of the perturbation of turbulent pressure and the dashed line to the absolute value of the contribution of the entropy perturbations (see Eq. (1)). The vertical dotted line corresponds to νmax.
Current usage metrics show cumulative count of Article Views (full-text article views including HTML views, PDF and ePub downloads, according to the available data) and Abstracts Views on Vision4Press platform.
Data correspond to usage on the plateform after 2015. The current usage metrics is available 48-96 hours after online publication and is updated daily on week days.
Initial download of the metrics may take a while.