Fig. 8
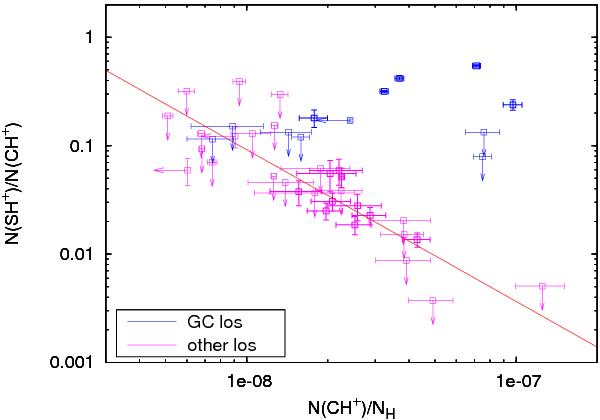
N(SH+)/N(CH+) column density ratio as a function of the CH+ mean abundance. The CH+, SH+, and H column densities are computed from CH+, 13CH+, SH+, HI, HF, and CH opacities integrated over the velocity intervals given in Tables 3 and 4. The blue and purple points are from the absorption lines observed along the Galactic centre sight lines (SgrA*+50 and SgrB2(N)) and along the other sight lines (DR21(OH), G34.3+0.1, W31C, W33A, W49N, and W51), respectively. The red line corresponds to a least-squares fit of the latter data.
Current usage metrics show cumulative count of Article Views (full-text article views including HTML views, PDF and ePub downloads, according to the available data) and Abstracts Views on Vision4Press platform.
Data correspond to usage on the plateform after 2015. The current usage metrics is available 48-96 hours after online publication and is updated daily on week days.
Initial download of the metrics may take a while.