| Issue |
A&A
Volume 540, April 2012
|
|
|---|---|---|
| Article Number | A87 | |
| Number of page(s) | 21 | |
| Section | Interstellar and circumstellar matter | |
| DOI | https://doi.org/10.1051/0004-6361/201117664 | |
| Published online | 30 March 2012 | |
Online material
Appendix A: Gaussian decomposition and calculation of column densities
The results of the Gaussian decomposition procedure applied to the spectra are given in Tables A.1. In turn, Figs. A.1–A.8 display the comparison between the result of the fit and the original data, along with the associated residuals. The uncertainties given in the Table A.1 are the formal 1-σ errors derived from the diagonal elements of the covariance matrix and do not take into account the systematic errors introduced by (1) the finite velocity resolution; (2) the uncertainty on the continuum level; and (3) the error introduced by the decomposition procedure, which depends on its convergence criteria.
According to Godard et al. (2010) (Appendix B), the finite velocity resolution of the spectra introduces an error on the linewidth determination smaller than 8% for the CH+ and 13CH+ components, and smaller than 14% for the SH+ components, if Δυ > 1.3 km s-1 (the smallest observed linewidth). Furthermore, a relative uncertainty ϵ on the continuum temperature leads to an error δτ ~ ϵ − ln(1 + ϵeτ) on the opacity that ranges between 6% and 30% when τ varies between 0.03 and 2.7 (the lowest and highest observed central opacities) and using ϵ = 10% (value corresponding to the error on the beam efficiency and the side band ratio, Roelfsema et al. 2012).
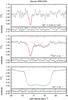 |
Fig. A.1
Observational data (black lines) compared to the multi-Gaussian decomposition (purple lines) of the SH+ (1,2,5/2 ← 0,1,3/2) (top), 13CH+(1 ← 0) (middle), and CH+ (1 ← 0) (bottom) absorption spectra observed towards DR21(OH). The solid red lines and the dashed blue lines correspond to the confirmed (C) and uncertain (U) Gaussian components, respectively (see main text). The solid green lines are the empirical modelling of the CH+saturated line profiles. |
| Open with DEXTER | |
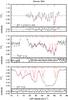 |
Fig. A.2
Same as Fig. A.1 for the observations towards G34.3+0.1. |
| Open with DEXTER | |
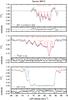 |
Fig. A.3
Same as Fig. A.1 for the observations towards W31C. |
| Open with DEXTER | |
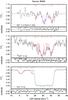 |
Fig. A.4
Same as Fig. A.1 for the observations towards W33A. |
| Open with DEXTER | |
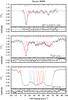 |
Fig. A.5
Same as Fig. A.1 for the observations towards W49N. |
| Open with DEXTER | |
CH+ (1 ← 0), 13CH+ (1 ← 0), and SH+ (1 ← 0) absorption line analysis results.
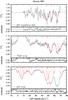 |
Fig. A.6
Same as Fig. A.1 for the observations towards W51. |
| Open with DEXTER | |
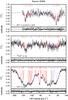 |
Fig. A.7
Same as Fig. A.1 for the observations towards SgrA*+50. |
| Open with DEXTER | |
Unlike the other numerical fitting methods10 that are devised to find the global minimum of χ2, the Levenberg Marquardt algorithm is a so-called single-shot method: used when the initial conditions are easily fixed, this algorithm takes advantage of the information on the χ2 derivatives with respect to each parameter to converge on the nearest local minimum. However, since the minimum only corresponds to a statistical estimate of the fit parameters, the code can converge on different solutions close to each other depending on the initial condition, the χ2 valley topography, and the criteria to stop the optimization. To estimate the associated error, we analysed the dispersion of the best-fit solutions when varying the initial conditions: for each spectrum, we assumed an uncertainty of 2 km s-1 on the initial guess of the positions and the linewidths of the Gaussians. The resulting 4200 fits are found to bracket the optimum solutions given in Table A.1 with a standard deviation of 10% on the central optical depths and the Gaussian linewidths.
When combined, the robustness of the decomposition procedure, the finite resolution, and the uncertainty on the continuum temperature correspond to maximal errors on the calculation of Δυ and τ of 20% and 30%, respectively.
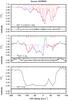 |
Fig. A.8
Same as Fig. A.1 for the observations towards SgrB2(N). |
| Open with DEXTER | |
Appendix B: Determination of the excitation temperatures and of the subsequent column densities
The column densities given in Table 3 are derived assuming a single excitation temperature Tex for all levels of a given molecule as 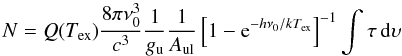 (B.1)where ν0, gu, gl and Aul are the rest frequency, the upper and lower level degeneracies and the Einstein’s coefficients of the observed transition, Q(Tex) is the partition funtion, and c is the speed of light.
To derive the CH+ and SH+J = 1 ← 0 line excitation temperatures Tex, we adopt the recent computation of the CH+ de-excitation rate coefficients by collision with He and e − (Hammami et al. 2009; Lim et al. 1999), and assume a generic SH+ de-excitation rate coefficient by collision with H and H2 of 10-10 cm3 s-1. Because the corresponding critical densities at 100 K, ncrit,He(CH+) ~ 6 × 107 cm-3, ncrit,e − (CH+) ~ 4 × 104 cm-3, and ncrit,H2(SH+) ~ 7 × 106 cm-3, are considerably higher than those of the diffuse ISM, collisions are irrelevant in the excitation of CH+ and SH+, all the more so collisions of CH+ with H2 are its destruction pathway. Therefore, the level populations of these two ions only result from radiative excitation and possible additional excitation processes during their chemical formation. Neglecting the latter, we derive the CH+ and SH+J = 1 ← 0 line excitation temperatures Tex, from statistical equilibrium, using the submillimetre interstellar radiation field measured at l = 45° and b = 0° with the Cosmic Background Explorer (Reach et al. 1995). We obtain low excitation temperatures Tex(835 GHz) = 4.4 K, and Tex(526 GHz) = 3.0 K that agree with the lack of CH+ (2 ← 1) and SH+ (21 ← 11), (22 ← 11), (21 ← 10), and (22 ← 12) detection in absorption at the velocities of the diffuse medium along the same lines of sight (PRISMAS and HEXOS observations, to be published). Note that an error of about 1 K corresponds to an error on the CH+ and SH+ column densities smaller than 1%. While these values of Tex are valid for the velocity components associated with the diffuse interstellar gas, they clearly correspond to lower limits for those associated with the SFRs molecular environments. In the latter case, since the PRISMAS lines of sight target bright IR and submm emitting sources, a complete description of the IR radiative transfer accross the molecular gas surrounding the sources is needed (De Luca et al., in prep.; Vastel et al., in prep.).
For excitation temperatures of 12,13CH+ and SH+ of 4.4 K and 3.0 K, respectively, Eq. (B.1) finally becomes 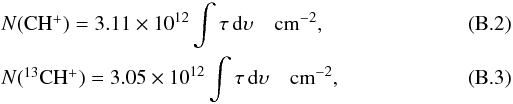 and
and 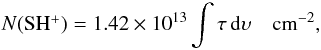 (B.4)using the CH+J = 1 ← 0, 13CH+J = 1 ← 0, and the SH+N,J,F = 1,2,5/2 ← 0,1,3/2 transitions, respectively.
The CH+ line opacity for N(CH+) = 1014 cm-2 and a linewidth of 4 km s-1 is of the order of 15 and the expected line emission is about 4 mK (below the noise level, see Tables 1 and 2). The intensities of the 13CH+ and SH+ lines that are optically thin are even lower.
Appendix C: Tracers of molecular hydrogen in the diffuse ISM
The methylidyne radical CH has often been used as a probe of molecular hydrogen because of its linear relation with H2 observed in the local diffuse medium (Federman 1982) and in dark clouds (Mattila 1986). Compiling the UV and visible data obtained on 48 lines of sight (Savage et al. 1977; Rachford et al. 2002; Crane et al. 1995; Crawford 1995; Allen 1994; Gredel et al. 1993; Federman et al. 1994; Danks et al. 1984; Jenniskens et al. 1992), Liszt & Lucas (2002) derived a mean ratio N(CH)/N(H2) ~ 4.3 × 10⁻⁸, while Sheffer et al. (2008) found N(CH)/N(H2) ~ 3.5 × 10⁻⁸, using their observations of the absorption profiles of H2 and CH on a sample of 90 diffuse clouds. Although the latter could be used in this work to estimate N(H2), based on the Herschel observations of the six hyperfine components of the CH J = 1/2 − 3/2 absorption line (Gerin et al. 2010b), it raises several problems that have to be taken into account.
-
As quoted by Liszt & Lucas (2002) and Shefferet al. (2008), there is a significantscatter (a dispersion of about a factor of 3) on theN(CH) − N(H2) relation observed in the local diffuse medium, up to N(H2) = 1021 cm-2.
-
Despite the similarity of the CH absorption profiles with those of other tracers of molecular hydrogen (PRISMAS observations, to be published), a N(CH) − N(H2) correlation has never been directly measured in the inner Galactic ISM.
-
Crane et al. (1995) and Lambert et al. (1990) found that the linewidths of CH observed in absorption are highly variable from one diffuse cloud component to another. They reported the detection of CH line profiles either similar to or more Gaussian and less broad than those of CH+. This result was then confirmed by Pan et al. (2005), who divided their observed CH absorption features into two categories: those with CN-like and those with CH+-like line profiles. This implies that the production of CH in the interstellar medium can sometimes be linked to the production of CH+and depends only slightly on the molecular hydrogen abundance (Godard et al., in prep.).
For these reasons, we derive the H2 column densities from observations of the J = 1 ← 0 ground-state rotational transition of hydrogen fluoride (HF) performed with the Herschel/HIFI instrument. If HF is saturated or not available, H2 is deduced from CH, assuming a mean HF/CH abundance ratio of 0.4 (see Cols. 5 and 6 of Table 4). The absorption line analysis performed by Neufeld et al. (2010b) and Sonnentrucker et al. (2010) showed that (1) the HF profiles are similar to those of H2O; and (2) HF accounts for more than 30% of the total fluorine nuclei in the gas-phase along these sight-lines. Since both results agree with the chemical models that predict that the production of HF does not depend on the dynamics of the gas and that HF is the main F-bearing species, we deduce the N(HF) − N(H2) relation from an analytical study of the fluorine chemistry. For the range of parameters defining the diffuse and transluscent gas (Snow & McCall 2006), 10 < nH < 5000 cm-3, 0 < AV < 5, and n(CO)/ [C] < 0.9, the abundance of HF is driven by only four chemical reactions (Neufeld & Wolfire 2009):
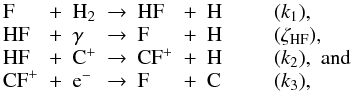 (C.1)where
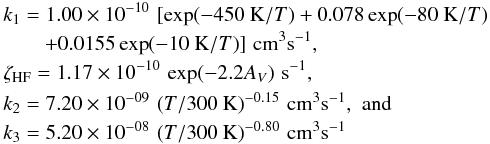 (C.2)are their respective reaction rate coefficients from the calculations and laboratory measurements (Zhu et al. 2002; Brown & Balint-Kurti 2000; Neufeld et al. 2005; Novotny et al. 2005). Therefore, assuming that there is no depletion of F on interstellar dust, and that the carbon is fully ionized and the sole source of electrons, the HF and H2 abundances are related by
 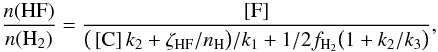 (C.3)where [F] and [C] are the fluorine and carbon elemental gas phase abundances relative to H nuclei (assumed to equal those observed in the solar neighbourhood, ~ 1.8 × 10⁻⁸ and ~ 1.4 × 10⁻⁴ respectively, Savage & Sembach 1996; Sofia & Meyer 2001; Snow et al. 2007), nH is the gas density, and fH2 is the molecular fraction defined as fH2 = 2n(H2)/nH. For nH > 30 cm-3 and AV > 0.2, because F reacts rapidly with H2, the left-hand side of the denominator of Eq. (C.3) can be neglected, more than 90% of the interstellar fluorine being in HF and less than 10% in CF+. We thus assume a n(HF)/n(H2) abundance ratio of 3.6 × 10⁻⁸.
Although HF is preferred to CH here as a tracer of molecular hydrogen, relation (C.3) has to be used cautiously because: (1) it has never been proven observationally; (2) this abundance ratio linearly depends on the fluorine elemental abundance, which can vary with the Galactocentric distance (Daflon & Cunha 2004; Rudolph et al. 2006; Abia et al. 2010); and (3) it also depends on the depletion of fluorine onto grains, which can become important in the molecular gas. We note that the H2 molecular fraction computed as 2N(H2)/NH on the velocity intervals given in Table 4 ranges between 0.05 and 1 with an average value of ~ 0.4 (Neufeld et al., in prep.). While this value suggests that the diffuse medium sampled by CH+, 13CH+, and SH+ is on average weakly molecular, it does not preclude the existence within this gas of regions where fH2 = 1. A complete analysis of HF and CH as tracers of molecular hydrogen will be performed by Godard et al. (in prep.).
© ESO, 2012
Current usage metrics show cumulative count of Article Views (full-text article views including HTML views, PDF and ePub downloads, according to the available data) and Abstracts Views on Vision4Press platform.
Data correspond to usage on the plateform after 2015. The current usage metrics is available 48-96 hours after online publication and is updated daily on week days.
Initial download of the metrics may take a while.