Fig. 7
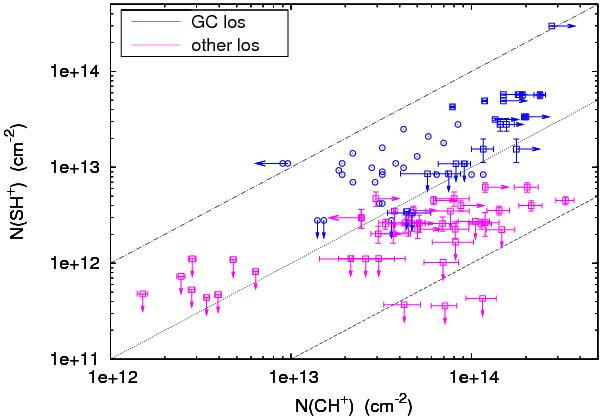
SH+ column density as a function of the CH+ column density per broad velocity interval (see Table 3). The open squares and open circles are from the present analysis and from Menten et al. (2011), respectively. The blue and purple points are from the absorption lines observed along the Galactic centre sight lines (SgrA*+50, SgrB2(N), and SgrB2(M)) and along the other sight lines (DR21(OH), G34.3+0.1, W31C, W33A, W49N, and W51), respectively. The black dashed, dotted, and dashed-dotted lines indicate N(SH+)/N(CH+) ratios of 0.01, 0.1, and 1, respectively.
Current usage metrics show cumulative count of Article Views (full-text article views including HTML views, PDF and ePub downloads, according to the available data) and Abstracts Views on Vision4Press platform.
Data correspond to usage on the plateform after 2015. The current usage metrics is available 48-96 hours after online publication and is updated daily on week days.
Initial download of the metrics may take a while.