Fig. 5
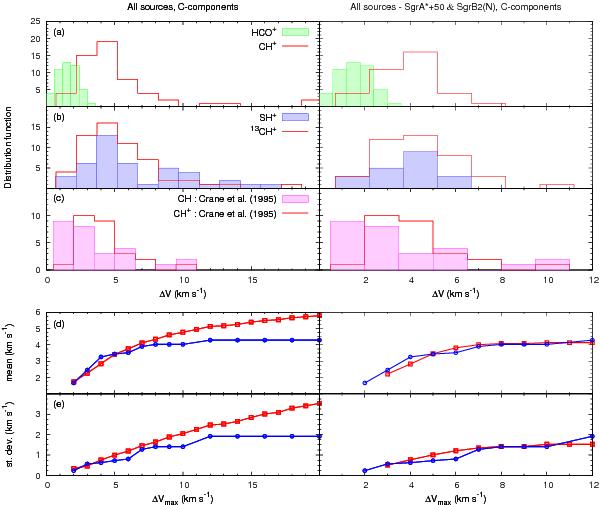
Top: a) and b) histogram of the linewidths of the CH+, 13CH+, SH+ (this work), and HCO+ (Godard et al. 2010) velocity components obtained with the multi-Gaussian decomposition procedure (see Table A.1); c) linewidth distributions of CH+ and CH observed by Crane et al. (1995) in the local diffuse medium. Bottom: first- (mean) and second- (standard deviation) order moments of the Δυ distributions issued from the combined CH+, 13CH+, and SH+ data (red squares) and from the CH+ data observed in the solar neighbourhood (blue circles); the moments are computed over increasing Δυ intervals: mean = 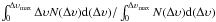 ; standard deviation =
  , where N(Δυ) is the linewidth distribution.
Current usage metrics show cumulative count of Article Views (full-text article views including HTML views, PDF and ePub downloads, according to the available data) and Abstracts Views on Vision4Press platform.
Data correspond to usage on the plateform after 2015. The current usage metrics is available 48-96 hours after online publication and is updated daily on week days.
Initial download of the metrics may take a while.